Day 2 — Linear Regression: How a Straight Line Learns From Data
Source: Dev.to
Riya is in school, and exams are coming.
Her elder sister notices something interesting:
| Study Hours | Marks |
|---|---|
| 1 hour | 20 |
| 2 hours | 40 |
| 3 hours | 60 |
The sister laughs and says:
“Arre, the more you study, the more marks you get — very predictable!”
Without knowing it, Riya’s sister just did Linear Regression.
So… What Is Linear Regression Really?
Forget the big name.
Linear Regression simply means: finding a straight‑line relationship between input and output.
In plain language:
- Input increases
- Output increases (or decreases)
in a steady, predictable way. That steady behavior is the key.
Why a “Straight Line”?
Because life is sometimes simple.
- More work experience → more salary
- Bigger house → higher price
- More units used → higher electricity bill
Your brain already expects a straight pattern. Linear regression just draws that pattern using data.
What Is the Model Actually Doing?
Imagine a board with many dots on it 📍— each dot is one real example.
Linear regression’s job is:
“Let me draw ONE straight line that passes as close as possible to all these dots.”
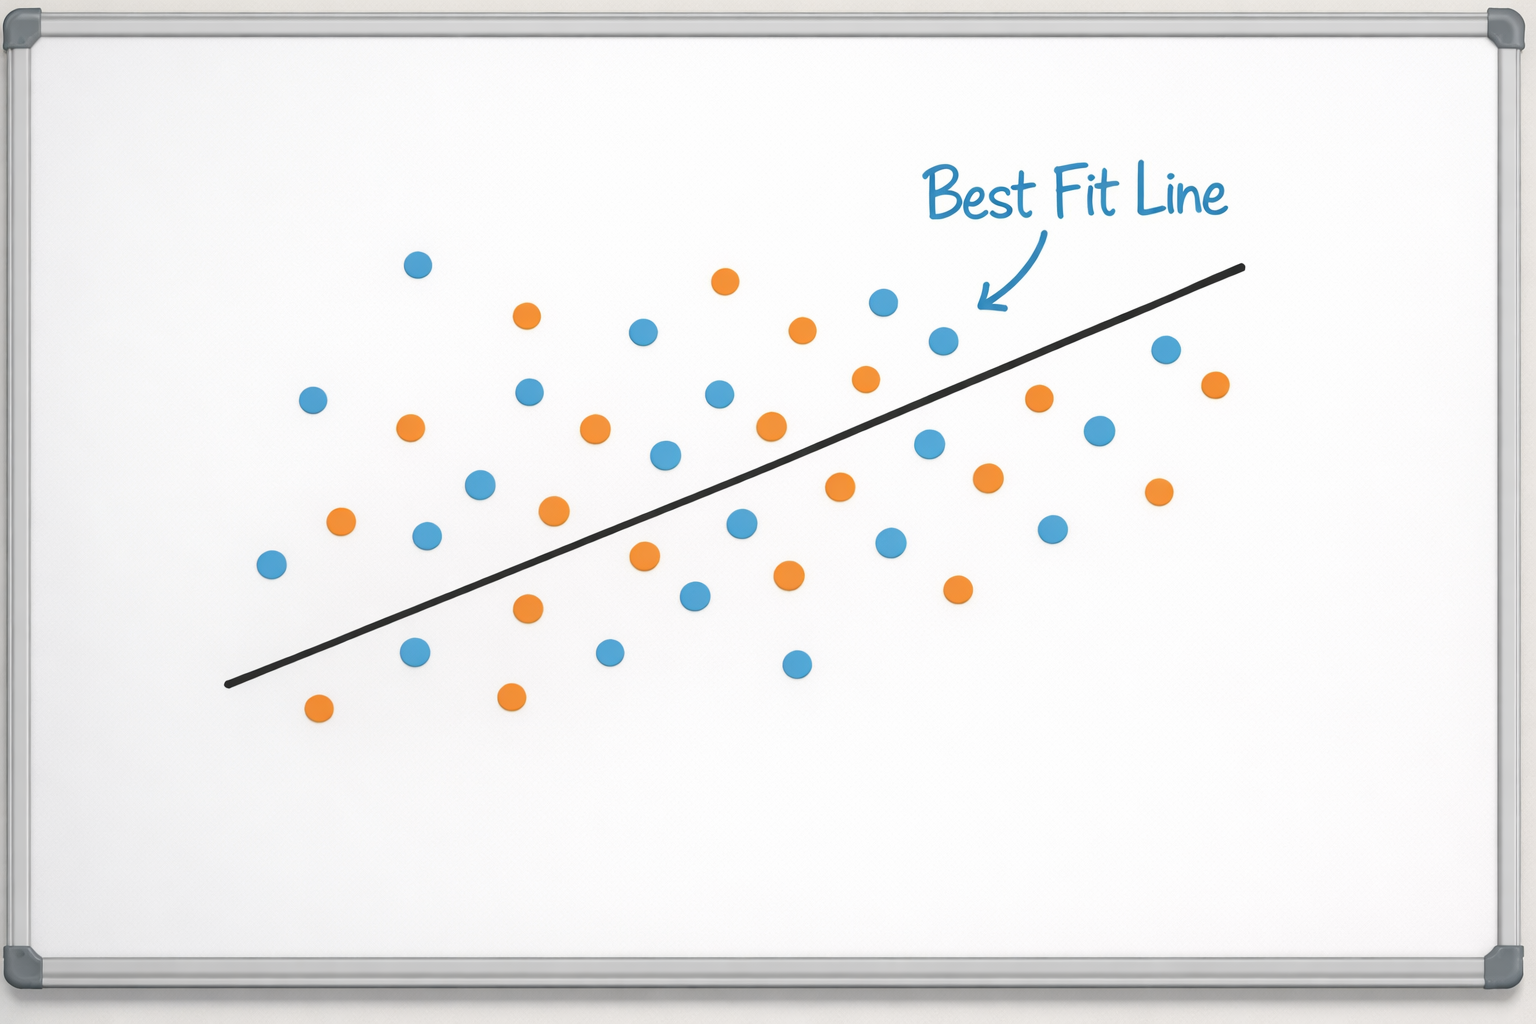
It doesn’t touch every dot, isn’t perfect, but it’s the best overall line. That’s the model.
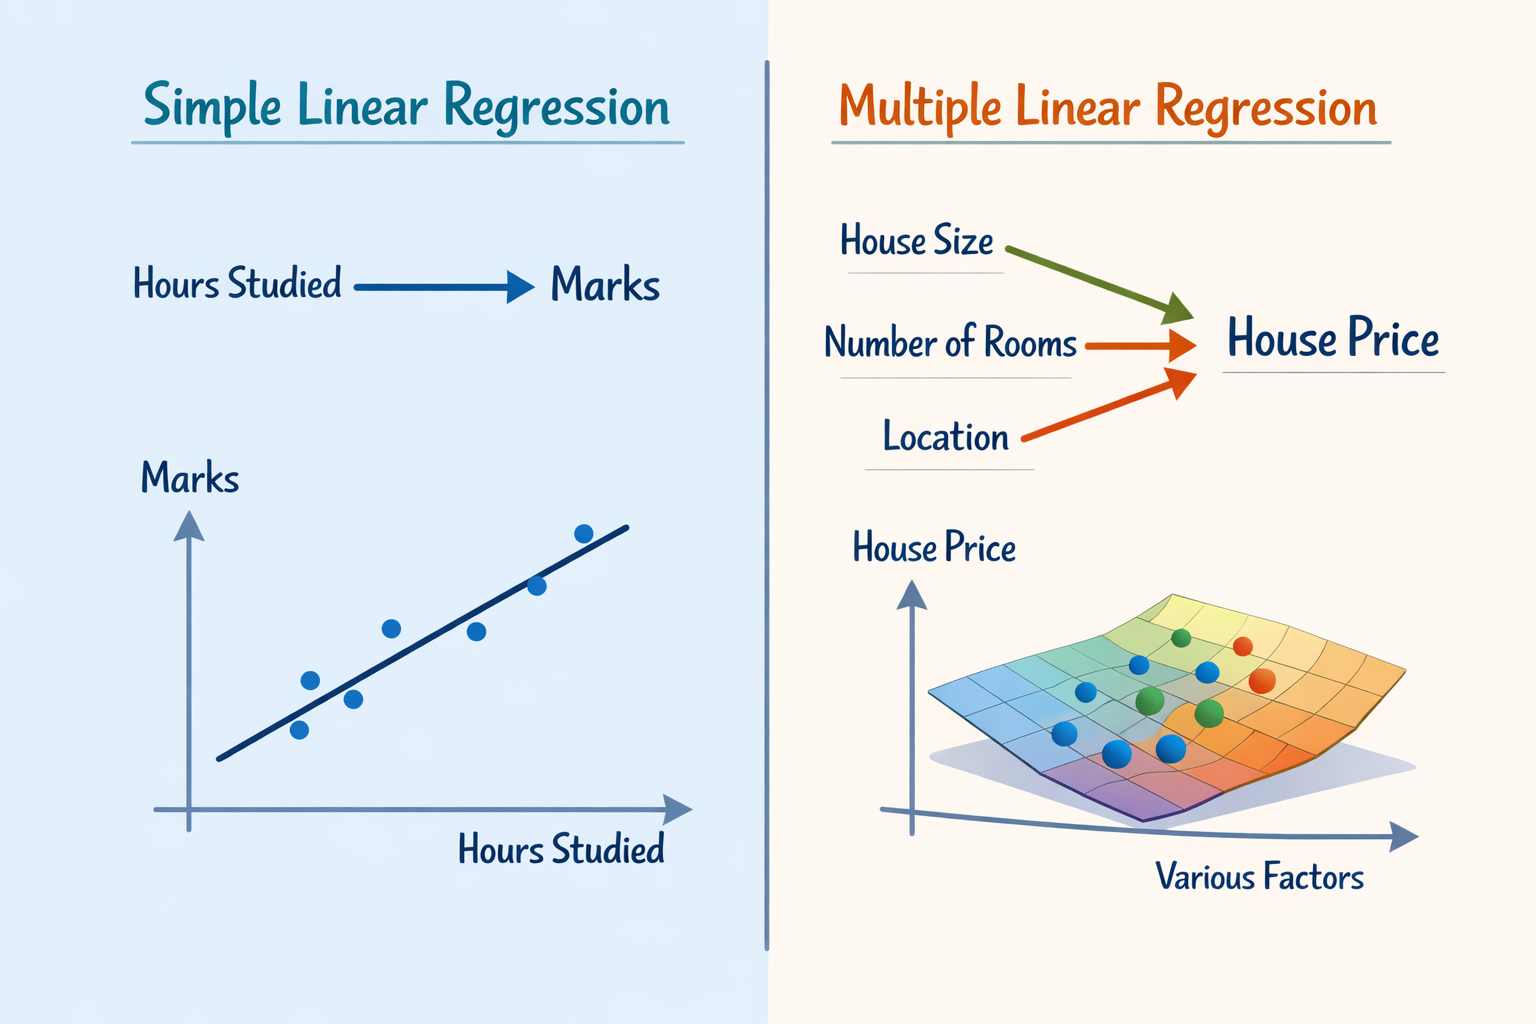
Simple vs Multiple Linear Regression
Simple Linear Regression
One input → one output
Example: Hours studied → Marks
Multiple Linear Regression
Many inputs → one output
Example: House size, number of rooms, location → House price
Same idea, just more information.
Coefficients — The Real Power
Imagine an HR manager deciding your salary based on two factors: experience and skills.
Salary = (Experience × 5000) + (Skills × 3000) + Base PayThe numbers 5000 and 3000 are called coefficients. They indicate how much each factor contributes:
- Larger coefficient → larger influence
- Smaller coefficient → smaller influence
Just like cooking: salt affects taste a lot, chili a bit less. Linear regression not only predicts a number—it explains why that number makes sense.

Intercept — The Starting Point
If someone has:
- 0 experience
- 0 skills
the salary isn’t zero because there’s usually a base salary. That base value is the intercept.
Intercept is where the line starts.
Why Linear Regression Is Everywhere
- Easy to understand
- Fast to train
- Easy to explain to managers
- Very popular in interviews
Interview truth: they care more about understanding the behavior than memorising the formula.
When This Straight Line Becomes a Bad Idea
If the data shows sudden jumps, random fluctuations, or clear curves (e.g., salary spikes, volatile prices), forcing a straight line is like “using a ruler to measure a circle.” It won’t work well. We’ll explore alternatives later.
Tiny Brain Exercise 🧠
Think about your monthly mobile bill:
- More data used → higher bill
- Less data used → lower bill
You already expect a straight relationship—that intuition is the basis of linear regression.
3 Things You Must Remember
- Linear regression fits a straight line.
- Coefficients show importance of each input.
- Intercept is the starting value.
What’s Coming Next 👀
Now that we have a line, the big question is:
How do we know if this line is good or terrible?
That’s where errors and loss functions come in.
👉 Day 3 — Errors & Loss Functions: Measuring How Wrong a Model Is