开发者调试 JAX 在云 TPU 上的指南:必备工具与技术
I’m happy to help translate the article, but I’ll need the full text you’d like translated. Could you please paste the content you want converted to Simplified Chinese? Once I have it, I’ll keep the source line exactly as you specified and provide the translation while preserving all formatting and technical terms.
作者
Brian Kang – 高级员工,现场解决方案架构师,AI 基础设施
JAX 在云 TPU 上为机器学习工作流提供强大的加速。在分布式云环境中工作时,您需要专用工具来调试工作流,包括访问日志、硬件指标等。本博文作为各种调试和分析技术的实用指南。
Source: …
选择合适的工具:核心组件与依赖关系
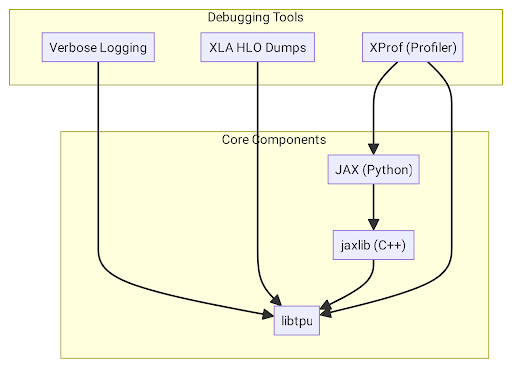
系统的核心有两个几乎所有调试工具都依赖的主要组件:
- libtpu(包含
libtpu.so,即 TPU Runtime)——每个 Cloud TPU VM 上的共享库,内含 XLA 编译器、TPU 驱动以及与硬件通信的逻辑。几乎所有调试工具都通过libtpu进行交互或配置。 - JAX 与 jaxlib ——框架本身。JAX 是编写模型代码的 Python 库;
jaxlib是其 C++ 后端,充当libtpu.so的桥梁。
下面的示意图展示了这些组件与调试工具之间的关系。
以下是各具体工具、它们的依赖以及相互关系的细分表。
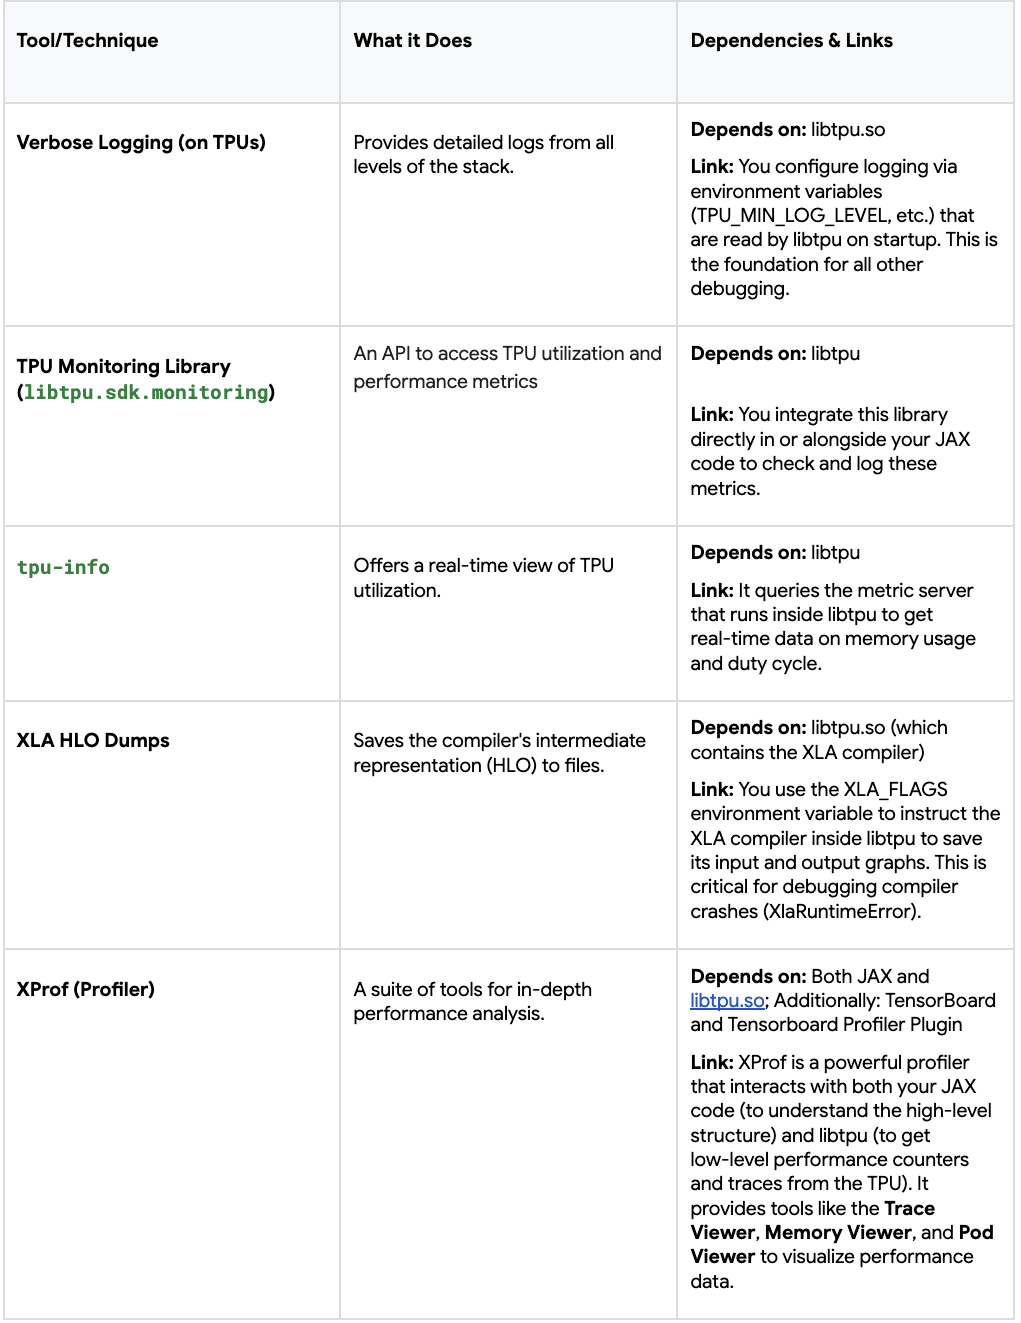
总之,libtpu 是大多数调试工具依赖的核心支柱,无论是用于配置(日志、HLO 转储)还是用于查询实时数据(监控、分析)。其他工具(如 XProf)则在 Python 层面直接检查 JAX 程序的状态。了解这些关系后,你就能更有效地为所面临的具体问题选择合适的工具。
每个工作负载的关键日志记录和诊断标志
详细日志记录
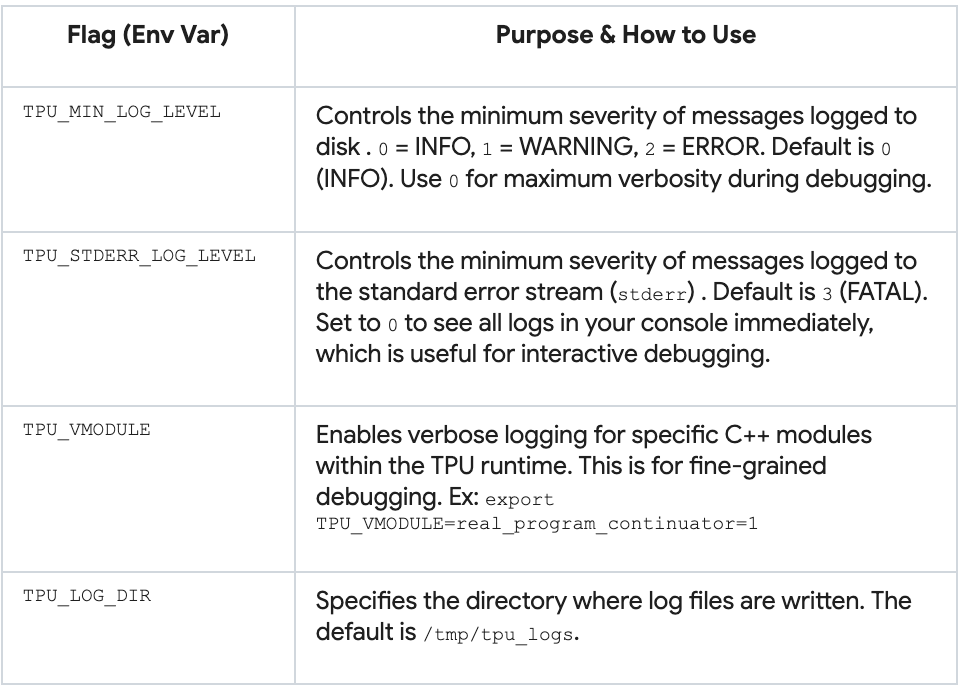
调试的最关键一步是启用详细日志记录。没有它,你就像盲目飞行。这些标志应当在 每个 TPU 切片的工作节点 上设置,以记录从 TPU 运行时初始化到程序执行步骤的所有信息,并带有时间戳。
在每个 TPU 工作节点上启用默认标志
gcloud alpha compute tpus queued-resources ssh ${QUEUED_RESOURCE_ID} \
  --project ${PROJECT_ID} --zone ${ZONE} --worker=all --node=all \
  --command='TPU_VMODULE=slice_configuration=1,real_program_continuator=1 \
            TPU_MIN_LOG_LEVEL=0 TF_CPP_MIN_LOG_LEVEL=0 TPU_STDERR_LOG_LEVEL=0 \
            python3 -c "import jax; print(f\"Host {jax.process_index()}: \
            Global devices: {jax.device_count()}, Local devices: \
            {jax.local_device_count()}\")"'
libtpu 日志会自动生成在每个 TPU VM 的 /tmp/tpu_logs/tpu_driver.INFO 中。该文件是了解 TPU 运行时实际行为的真实依据。若要从 所有 TPU VM 收集日志,请运行下面的脚本:
#!/bin/bash

TPU_NAME="your-tpu-name"
PROJECT="your-project-id"
ZONE="your-tpu-zone"
BASE_LOG_DIR="path/to/local/log/dir"

NUM_WORKERS=$(gcloud compute tpus tpu-vm describe "$TPU_NAME" \
               --zone="$ZONE" --project="$PROJECT" \
               | grep tpuVmSelflink | awk -F'[:/]' '{print $13}' | uniq | wc -l)

echo "Number of workers = $NUM_WORKERS"

for ((i=0; i<NUM_WORKERS; i++)); do
  mkdir -p "${BASE_LOG_DIR}/$i"
  echo "Downloading logs from worker=$i ..."
  gcloud compute tpus tpu-vm scp "${TPU_NAME}:/tmp/tpu_logs/*" \
       "${BASE_LOG_DIR}/$i/" --zone="${ZONE}" --project="${PROJECT}" --worker=$i
done
在 Google Colab 中,你可以通过 os.environ 设置相同的环境变量,并在左侧的 Files 面板中访问日志。
日志示例片段
...
I1031 19:02:51.863599     669 b295d63588a.cc:843] Process id 669
I1031 19:02:51.863609     669 b295d63588a.cc:848] Current working directory /content
...
I1031 19:02:51.863621     669 b295d63588a.cc:866] Build tool: Bazel, release r4rca-2025.05.26-2 (mainline @763214608)
I1031 19:02:51.863621     669 b295d63588a.cc:867] Build target:
I1031 19:02:51.863624     669 b295d63588a.cc:874] Command line arguments:
I1031 19:02:51.863624     669 b295d63588a.cc:876] argv[0]: './tpu_driver'
...
I1031 19:02:51.863784     669 init.cc:78] Remote crash gathering hook installed.
I1031 19:02:51.863807     669 tpu_runtime_type_flags.cc:79] --tpu_use_tfrt not specified. Using default value: true
I1031 19:02:51.873759     669 tpu_hal.cc:448] Registered plugin from module: breakpoint_debugger_server
...
I1031 19:02:51.879890     669 pending_event_logger.cc:896] Enabling PjRt/TPU event dependency logging
I1031 19:02:51.880524     843 device_util.cc:124] Found 1 TPU v5 lite chips.
...
I1031 19:02:53.471830     851 2a886c8_compiler_base.cc:3677] CODE_GENERATION stage duration: 3.610218ms
I1031 19:02:53.471885
851 isa_program_util_common.cc:486] (HLO module jit_add): Executable fingerprint:0cae8d08bd660ddbee7ef03654ae249ae4122b40da162a3b0ca2cd4bb4b3a19c
TPU 监控库
TPU 监控库提供对 TPU 硬件上工作流性能(利用率、容量、延迟等)的编程式洞察。它是 libtpu 包的一部分,jax[tpu] 会自动将其作为依赖安装。
# 显式安装
pip install "jax[tpu]" libtpu
你可以使用 tpumonitoring.list_supported_metrics() 查看所有支持的指标,使用 tpumonitoring.get_metric 获取特定指标。下面的示例打印 duty_cycle_pct 数据及其描述:
from libtpu.sdk import tpumonitoring

duty_cycle_metric = tpumonitoring.get_metric("duty_cycle_pct")
duty_cycle_data = duty_cycle_metric.data

print("TPU D")
Source: …
uty Cycle Data:")
print(f"  Description: {duty_cycle_metric.description}")
print(f"  Data: {duty_cycle_data}")
了解更多关于监控库的信息,请参阅 Cloud TPU 文档。
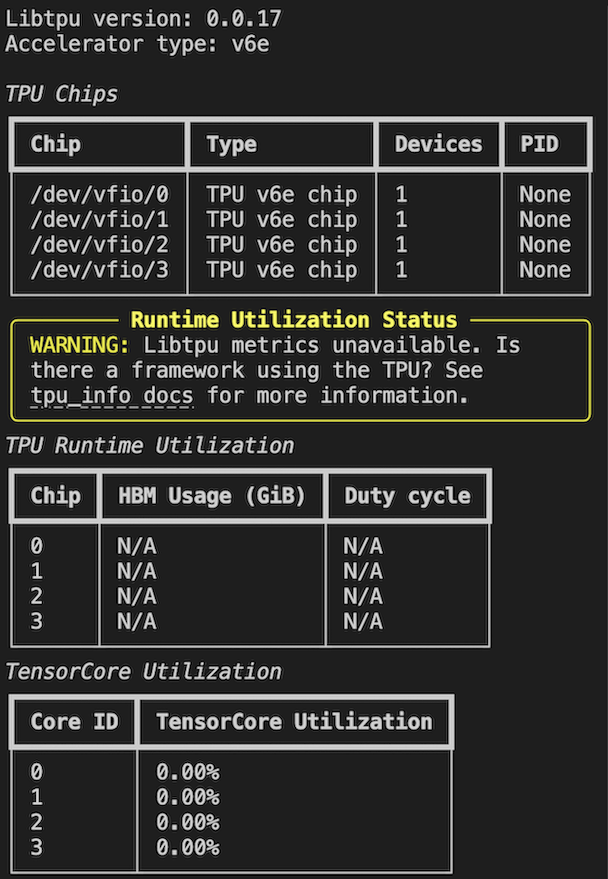
tpu‑info
tpu‑info CLI 提供 TPU 内存和利用率指标的实时视图,类似于 GPU 的 nvidia‑smi。
在所有 worker 和节点上安装
gcloud alpha compute tpus queued-resources ssh ${QUEUED_RESOURCE_ID} \
  --project ${PROJECT_ID} \
  --zone ${ZONE} \
  --worker=all \
  --node=all \
  --command='pip install tpu-info'
在单个 worker 和节点上检查芯片利用率
gcloud alpha compute tpus queued-resources ssh ${QUEUED_RESOURCE_ID} \
  --project ${PROJECT_ID} \
  --zone ${ZONE} \
  --worker=0 \
  --node=0

tpu-info
当芯片正在使用时,会显示进程 ID、内存使用情况和占空比 %:
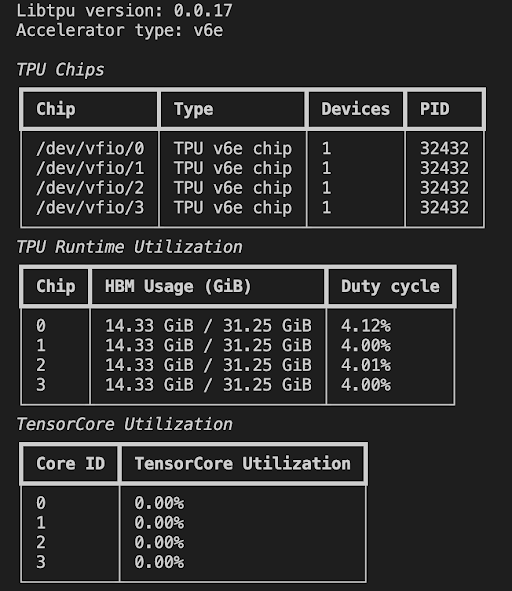
当没有芯片在使用时,TPU VM 将显示无活动:
了解更多关于附加指标和流式模式的信息,请参阅文档。
下一步
在本篇文章中,我们介绍了 TPU 的日志记录和监控选项。下一篇我们将探讨如何调试你的 JAX 程序——从生成 HLO 转储和使用 XProf 对代码进行分析开始。
导航