Maptheron 지형 데이터를 활용한 3D 지도 애플리케이션 구축
Source: Dev.to
번역을 진행하려면 번역하고자 하는 본문 텍스트를 제공해 주세요. 코드 블록이나 URL은 그대로 유지하고, 본문 내용만 한국어로 번역해 드리겠습니다.
Source: …
Mapterhorn 소개

Mapterhorn은 PMTiles 형식으로 지형 데이터를 공개하는 오픈‑데이터 프로젝트입니다.
ESA의 Copernicus DEM, 스위스의 swissALTI3D 등 다양한 공개 소스에서 지형 타일을 생성하고 이를 자유롭게 제공합니다.
이 프로젝트는 이전에 **MapLibre**에서 활동했던 **Oliver Wipfli**가 이끌고 있습니다.
저는 FOSS4G Hokkaido 2025와 FOSS4G Japan 2025 발표에서 Mapterhorn을 “주목할 프로젝트”로 소개했습니다.
발표 슬라이드
Geospatialの世界最前線を探る [2025年版] – Speaker Deck

FOSS4G 2025 Japan – Presentation Material

데이터 개요
Mapterhorn은 여러 개방형 데이터 소스를 결합하여 지형 타일을 생성합니다.
글로벌 데이터
| 데이터 소스 | 해상도 | 줌 레벨 | 비고 |
|---|---|---|---|
| Copernicus GLO‑30 | 30 m | z0 – z12 | ESA 글로벌 DEM |
글로벌 데이터셋은 ESA의 Copernicus GLO‑30 모델을 기반으로 하며 z12까지 전 세계를 포괄합니다.
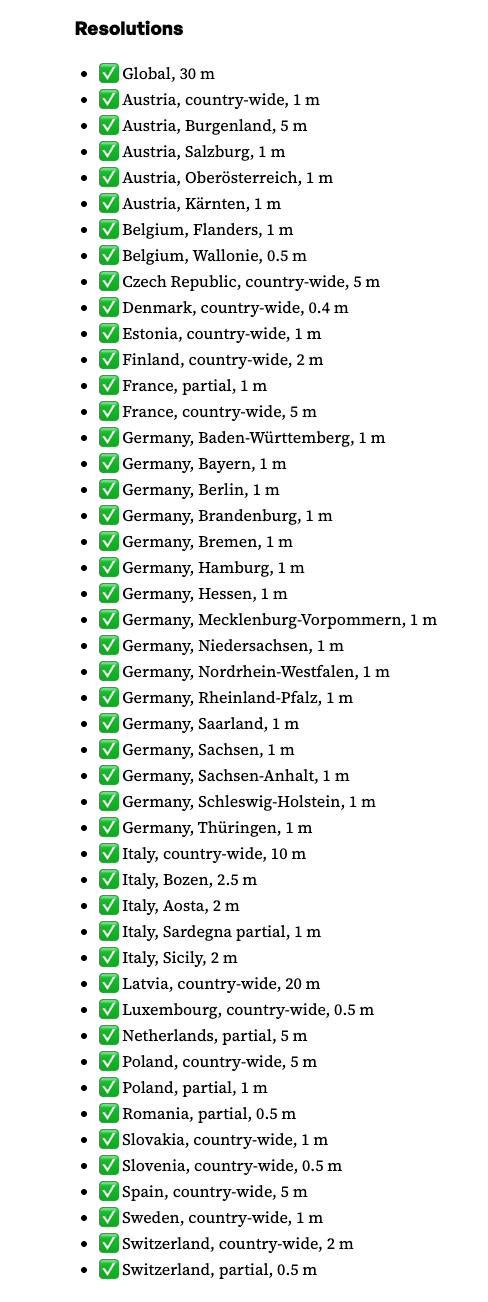
고해상도 데이터
 {width=800}
글로벌 데이터셋 외에도 Mapterhorn은 여러 유럽 국가의 개방형 DEM/LiDAR 소스를 활용한 고해상도 데이터를 제공합니다.
- 스위스 – swisstopo의 swissALTI3D (0.5 m 해상도)
일본 데이터
업데이트 (2025년 12월): 일본에 대한 고해상도 데이터가 추가되었습니다.
- ✅ 일본 (전국) – 1 m, 5 m, 10 m
LinkedIn 발표:
Pull request adding the sources (replace with actual URL)
사전 준비
실행 환경
- Node v24.4.1
- npm v11.4.2
MapLibre GL JS 스타터
시작 저장소를 포크하거나 다운로드하고 로컬에서 실행합니다.
저장소 구조
maplibregljs-starter
├── dist
│   └── index.html
├── img
├── src
│   ├── main.ts
│   ├── style.css
│   └── vite-env.d.ts
├── README.md
├── LICENSE
├── index.html
├── package-lock.json
├── package.json
├── tsconfig.json
└── vite.config.ts
의존성 설치
npm install          # 프로젝트 의존성 설치
npm install pmtiles  # PMTiles 라이브러리 추가
package.json
{
  "name": "maplibregljs-starter",
  "version": "4.5.0",
  "description": "",
  "scripts": {
    "dev": "vite",
    "build": "tsc && vite build",
    "preview": "vite preview"
  },
  "keywords": [],
  "author": "MapLibre User Group Japan",
  "license": "ISC",
  "devDependencies": {
    "typescript": "^5.5.2",
    "vite": "^5.3.2"
  },
  "dependencies": {
    "maplibre-gl": "^4.5.0",
    "pmtiles": "^4.3.0"
  }
}
Source: …
지도 애플리케이션 만들기
아래 코드는 Mapterhorn 지형 데이터를 MapLibre GL과 PMTiles 프로토콜을 사용해 표시하는 방법을 보여줍니다.
src/main.ts파일의 내용을 아래 코드로 교체합니다.npm run dev명령으로 개발 서버를 실행합니다.- 터미널에 출력된 URL(보통
http://localhost:5173)을 열어 hill‑shade 음영이 적용된 지형을 확인합니다.
// src/main.ts
import './style.css';
import 'maplibre-gl/dist/maplibre-gl.css';
import maplibregl from 'maplibre-gl';
import { Protocol } from 'pmtiles';

// Enable the PMTiles protocol (metadata support is optional but useful)
const protocol = new Protocol({ metadata: true });

/**
 * Register a custom protocol (`mapterhorn://`) that resolves to PMTiles tiles.
 * The protocol extracts the z/x/y values from the URL, builds the PMTiles URL,
 * and asks the PMTiles library to fetch the tile.
 */
maplibregl.addProtocol('mapterhorn', async (params, abortController) => {
  const [z, x, y] = params.url
    .replace('mapterhorn://', '')
    .split('/')
    .map(Number);

  // Simple naming scheme – adjust if your PMTiles files follow a different convention.
  const name = `${z}-${x}-${y}`;

  // Build the PMTiles URL. The tile is stored as a WebP image inside the PMTiles file.
  const url = `pmtiles://download.mapterhorn.com/${name}.pmtiles/${z}/${x}/${y}.webp`;

  const response = await protocol.tile({ ...params, url }, abortController);

  if (response.data === null) {
    throw new Error(`Tile z=${z} x=${x} y=${y} not found.`);
  }

  return response;
});

// Initialise the MapLibre map
const map = new maplibregl.Map({
  container: 'map',
  hash: true,
  style: {
    version: 8,
    sources: {
      hillshadeSource: {
        type: 'raster-dem',
        tiles: ['mapterhorn://{z}/{x}/{y}'],
        encoding: 'terrarium',
        tileSize: 512,
        attribution: '[© Mapterhorn](https://mapterhorn.com/attribution)'
      }
    },
    layers: [
      {
        id: 'hillshade',
        type: 'hillshade',
        source: 'hillshadeSource'
      }
    ]
  },
  center: [138.7782, 35.3019], // Approx. Osaka, Japan
  zoom: 10
});

map.addControl(new maplibregl.NavigationControl());
애플리케이션 실행하기
npm run dev개발 서버가 시작되면 터미널에 표시된 URL(보통 http://localhost:5173)을 엽니다. Mapterhorn 지형이 hill‑shade 렌더링으로 시각화된 것을 확인할 수 있습니다.
팁: PMTiles 파일 이름 규칙이 위에서 사용한
${z}-${x}-${y}패턴과 다르면,addProtocol내부의name생성 로직을 해당 규칙에 맞게 수정하세요.
네비게이션 컨트롤 추가
map.addControl(
  new maplibregl.NavigationControl({
    visualizePitch: true
  })
);
Source: …
3‑D 지형 렌더링
MapLibre GL JS의 terrain 기능을 사용하면 3‑D 지형을 손쉽게 시각화할 수 있습니다. 아래 예제는 다음을 보여줍니다:
- 래스터‑DEM 타일용
pmtiles프로토콜을 사용자 정의로 추가하기, - 래스터 베이스맵 로드하기,
- 힐‑쉐이드와 3‑D 지형 표면 표시하기,
- 피치 시각화가 포함된 네비게이션 컨트롤 추가하기.
예제 코드
// style.css is imported only for the page layout – it is not required for the map itself.
import './style.css';
import 'maplibre-gl/dist/maplibre-gl.css';
import maplibregl from 'maplibre-gl';
import { Protocol } from 'pmtiles';

// Initialise the PMTiles protocol (metadata is required for DEM tiles)
const protocol = new Protocol({ metadata: true });

/**
 * Custom protocol “mapterhorn” that resolves DEM tiles stored as PMTiles.
 * The tile URL format used by Mapterhorn is:
 *   pmtiles://https://download.mapterhorn.com/<name>.pmtiles/<z>/<x>/<y>.webp
 *
 * The <name> part is derived from the zoom level and the y‑coordinate.
 */
maplibregl.addProtocol('mapterhorn', async (params, abortController) => {
  const [z, x, y] = params.url
    .replace('mapterhorn://', '')
    .split('/')
    .map(Number);

  // Example naming scheme – adjust if your tile set uses a different pattern
  const name = `${z}-${y >> (z - 6)}`; // “z‑shifted‑y” pattern used by Mapterhorn

  const url = `pmtiles://https://download.mapterhorn.com/${name}.pmtiles/${z}/${x}/${y}.webp`;

  const response = await protocol.tile({ ...params, url }, abortController);
  if (response.data === null) {
    throw new Error(`Tile z=${z} x=${x} y=${y} not found.`);
  }
  return response;
});

// Create the map
const map = new maplibregl.Map({
  container: 'map',
  hash: 'map',
  style: {
    version: 8,
    sources: {
      // Basemap
      MIERUNEMAP: {
        type: 'raster',
        tiles: ['https://tile.mierune.co.jp/mierune/{z}/{x}/{y}.png'],
        tileSize: 256,
        attribution:
          'Maptiles by MIERUNE, under CC BY. Data by OpenStreetMap contributors, under ODbL.'
      },

      // DEM source (raster‑DEM)
      terrainSource: {
        type: 'raster-dem',
        tiles: ['mapterhorn://{z}/{x}/{y}'],
        encoding: 'terrarium',
        tileSize: 512,
        attribution: '[© Mapterhorn](https://mapterhorn.com/attribution)'
      }
    },

    layers: [
      { id: 'MIERUNEMAP', type: 'raster', source: 'MIERUNEMAP' },
      { id: 'hillshade', type: 'hillshade', source: 'terrainSource' }
    ],

    terrain: {
      source: 'terrainSource',
      exaggeration: 1.5
    }
  },

  center: [138.8016, 35.2395],
  zoom: 11,
  pitch: 60,
  bearing: -20
});

map.addControl(
  new maplibregl.NavigationControl({
    visualizePitch: true
  })
);
스크린샷
| 설명 | 이미지 |
|---|---|
| 네비게이션 컨트롤이 있는 지도 |  |
| 3‑D 지형이 적용된 지도 |  |
팁: terrain 객체의 exaggeration 값을 조정하여 원하는 시각 스타일을 적용하세요. 값이 클수록 산이 더 가파르게 보이며, 1에 가까운 값은 실제 규모에 가깝게 지형을 표시합니다.