Data Modelling And Schemas in Power Bi,Relationships and clarification:Beginner.
Published: (February 1, 2026 at 02:18 PM EST)
2 min read
Source: Dev.to
Source: Dev.to
What is Data Modelling
- Data modelling is the process of organizing tables and defining relationships between them so Power BI can understand how data connects.
- It works like a map of connections:
- Tables = locations where data is stored.
- Relationships = roads connecting the tables.
- DAX calculations = directions that rely on the roads being correct.
Benefits of a Good Model
- Accurate calculations
- Better performance
- Easier report building
- Scalability for large datasets
What is a Schema in Power BI
- A schema describes the structure of your data model—how tables are arranged and connected.
Power BI Schemas
Power BI typically follows data‑warehouse schemas, mainly:
- Star schema
- Snowflake schema
- Flat table (single table)
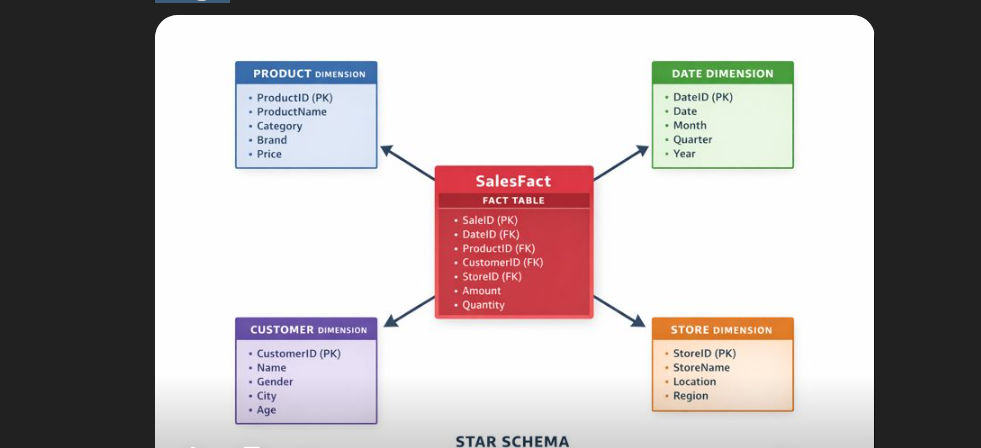
Star Schema
The star schema is the most recommended structure in Power BI.
Structure
- Fact Table (center)
- Dimension Tables (around it)
Fact Table Example
| Column |
|---|
| OrderID |
| ProductId |
| CustomerID |
| DateID |
| SalesAmount |
Dimension Tables
- Products (ProductId, ProductName, Category)
- Customers (CustomerID, CustomerName, Region)
- Date (DateID, Year, Month, Day)
Importance
- Simple relationships
- Faster performance
- Easier DAX calculations
- Clear visuals
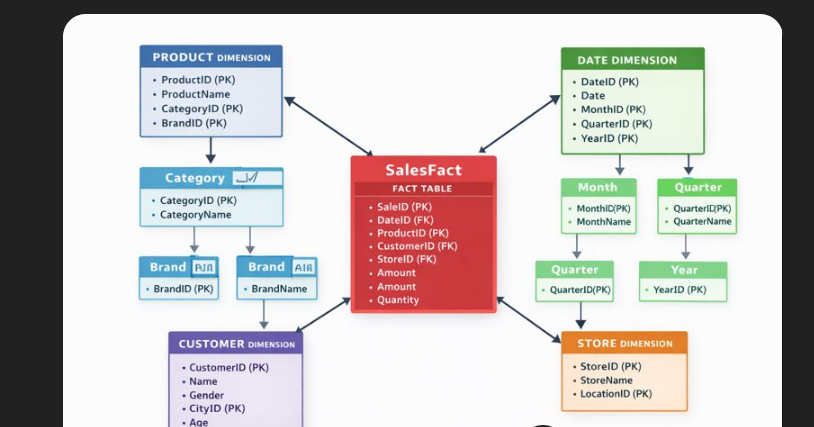
Snowflake Schema
The snowflake schema is a more normalized version of the star schema.
Structure
- Dimensions are split into multiple related tables (e.g., product → categories → subcategories).
- Reduces data duplication.
- Useful for complex hierarchies.
Cardinality
- Describes how rows match between tables.
- One‑to‑many (1:*) – e.g., one customer → many sales.
- One‑to‑one – rare.
- Many‑to‑many (*) – avoid if possible.
Filter Direction (Important)
- Single Direction – filter flow from dimension to fact table, preventing ambiguity.