Understanding Schemas and Data modeling in Power BI
Source: Dev.to
Introduction
Power BI is a business‑intelligence and data‑visualization tool developed by Microsoft that allows users to connect to multiple data sources, transform and model data, and create reports and dashboards. In this article we will go through the various schemas and data models in Power BI.
Let’s begin with schemas.
What is a schema?
In Power BI, a schema refers to the structure and organization of data within a data model, defining how data is connected and related. By understanding schemas, we can design optimal data models that enable comprehensive analysis.
Types of Schemas in Power BI
1. Star Schema
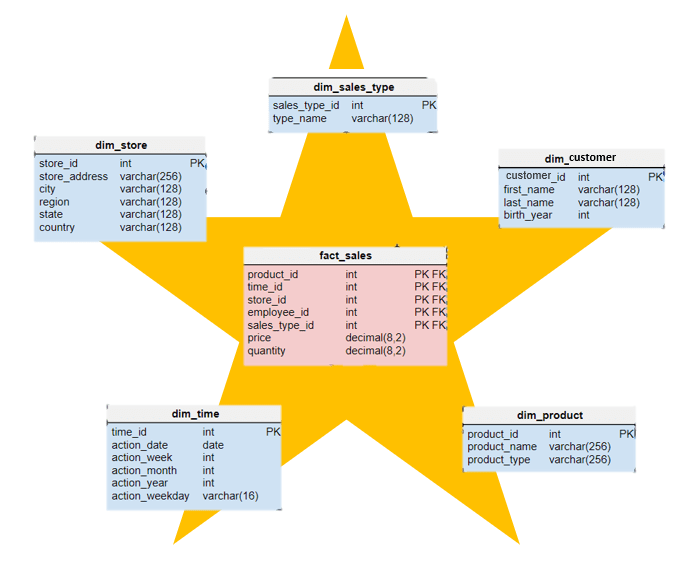
A star schema consists of one central fact table surrounded by dimension tables, forming a star‑like pattern.
- Fact table – contains measurable data (e.g., Sales).
- Dimension tables – hold descriptive attributes related to the facts (e.g., Customers, Date).
Star schemas are ideal for straightforward reporting and querying, making them suitable for dashboards and summary reports.
2. Snowflake Schema
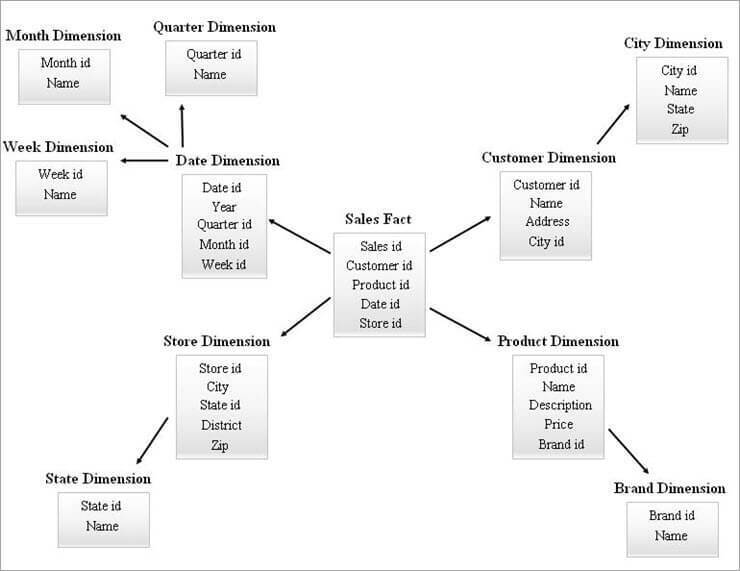
A snowflake schema is an extension of a star schema where dimension tables are further normalized into sub‑dimension tables, creating a structure that resembles a snowflake.
Example: A Products dimension can be split into Category and Brand tables.
Benefits: reduces data redundancy by introducing more tables and joins, which can save storage space. Snowflake schemas are ideal when storage optimization is critical and a detailed data model is required.
3. Galaxy Schema (Fact Constellation Schema)
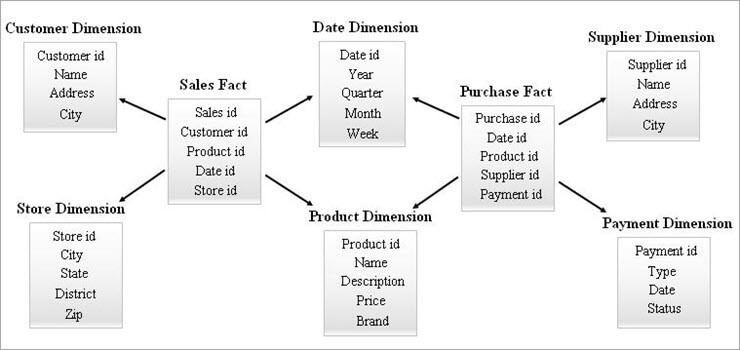
A galaxy schema (also called a fact constellation schema) involves multiple fact tables that share dimension tables, forming a complex, interconnected constellation.
Galaxy schemas are suited for large‑scale enterprise environments where multi‑process or interrelated metric analytics are needed (e.g., finance and operations analysis).
How to Implement Schemas in Power BI
a. Star Schema
- Set up fact and dimension tables – Identify and create a central fact table and surrounding dimension tables.
Example: A Sales fact table with Product and Customer dimension tables. - Link tables – Establish relationships between the fact table and each dimension table using foreign keys.
Example: Link Sales to Customer via theCustomerIDforeign key.
b. Snowflake Schema
- Normalize dimension tables – Split dimension tables into related sub‑tables.
Example: Split Product into Category and Brand tables. - Create relationships – Define relationships between sub‑tables and the main tables while maintaining referential integrity.
Example: Split Customer into City and Region tables, linking them to the Customer table viaCityID. - Optimize storage – Use appropriate storage and indexing strategies to manage complex joins efficiently.
c. Galaxy Schema
- Identify fact tables – Determine the various fact tables needed for different business processes.
Example: A Sales fact table and a Shipping fact table. - Identify shared dimension tables – Determine dimension tables that are common to multiple fact tables.
Example: Both Sales and Shipping can be linked through a shared Product dimension table.
Data Modeling
What is Data Modeling?
A data model is the structure of the data that we create for businesses. Data modeling is the process of structuring and organizing data from various sources into a coherent semantic model by:
- Defining tables.
- Establishing relationships between them.
- Creating calculated columns and measures using DAX.
- Setting hierarchies.
- Optimizing for performance.
Types of Data Models
1. Conceptual Data Modeling
Provides a high‑level view of what the system will contain, how it will be organized, and which business rules are involved. It answers questions such as:
- What data do we need?
- What does the business desire?
- What data do we have access to?
- Where can we find this data?
2. Logical Data Modeling
Offers greater detail about the concepts and relationships in the domain. It includes facts (e.g., purchase events) and dimensions (e.g., customers) and defines how they relate.
3. Physical Data Modeling
Describes how data is stored in the database, including tables, columns, indexes, and storage specifications.
End of document.
Physical Data Model
A physical data model describes how data will be physically stored within a database. It provides a finalized design that can be implemented as a relational database. Physical data models answer the following questions:
- What are the columns of your data?
- What are the data types of your data?
- How are you storing this data?
- How can you compress this data to make it smaller?
Data Modeling Process
The following sequence of tasks is performed iteratively to create data models.
Identify entities – Begin by identifying the things, events, or concepts (entities) represented in the data set to be modeled.
Identify key properties of each entity – Each entity is distinguished by one or more unique properties, called attributes.
- Example: a Customer entity might have attributes such as First Name, Last Name, and Telephone Number.
- Example: an Address entity might include Street Name & Number, City, State, Country, and ZIP Code.
Identify relationships among entities – Specify the nature of the relationship each entity has with the others.
- Example: a Customer lives at an Address.
Map attributes to entities completely – Ensure the model reflects how the business will use the data.
Assign keys and decide on a degree of normalization – Balance the need to reduce redundancy with performance requirements.
Normalization is a technique of organizing data models in which numerical identifiers (keys) are assigned to groups of data to represent relationships without repeating the data.
Finalize and validate the data model – Data modeling is iterative; repeat and refine the model as business needs change.
Types of Data Modeling
| # | Type | Description |
|---|---|---|
| 1 | Hierarchical data modeling | Each record has a single root parent that maps to one or more child tables, creating a tree‑like format. |
| 2 | Relational data modeling | Data segments are explicitly joined through tables, reducing database complexity. |
| 3 | Entity‑relationship (ER) data modeling | Formal diagrams represent the relationships between entities in a database. |
| 4 | Object‑oriented data modeling | Objects are grouped in class hierarchies and have associated features. |
| 5 | Dimensional data modeling | Designed to optimize data‑retrieval speeds for analytic purposes in a data warehouse. |
Why Perform Data Modeling?
Data modeling makes it easier for developers, data architects, business analysts, and other stakeholders to view and understand relationships among the data in a database or data warehouse. Additionally, data modeling can:
- Reduce errors in software and database development.
- Improve application and database performance.
- Ease data mapping throughout the organization.
- Improve communication between developers and business‑intelligence teams.
- Speed the process of database design at the conceptual, logical, and physical levels.
Conclusion
In this article we covered schemas and data modeling. Understanding different schemas in Power BI is crucial for designing efficient data models. Each schema has unique advantages; by choosing the right one you can improve query performance, data‑storage efficiency, and data‑refresh operations.
Mastering these schemas enables you to create robust, scalable data models that empower your organization to make data‑driven decisions effectively.
Data modeling is a critical foundation for effective data management and analytics. By progressing through conceptual, logical, and physical models, organizations can move from high‑level business requirements to detailed, implementable database designs.