使用 Mapterhorn 地形数据构建 3D 地图应用
Source: Dev.to
请提供您希望翻译的正文内容,我将为您翻译成简体中文并保留原有的格式、Markdown 语法以及技术术语。
关于 Mapterhorn

Mapterhorn 是一个开放数据项目,发布地形数据为 PMTiles。
它从各种公共来源(例如 ESA 的 Copernicus DEM、瑞士的 swissALTI3D)创建地形瓦片,并免费提供。
该项目由 Oliver Wipfli 领衔,他曾在 MapLibre 工作。
我在 FOSS4G Hokkaido 2025 和 FOSS4G Japan 2025 的演讲中将 Mapterhorn 列为“值得关注的项目”。
演示幻灯片
探索地理空间的世界前沿 [2025版] – 演讲者幻灯片

FOSS4G 2025 Japan – 演示材料

数据集概览
Mapterhorn 通过组合多个开放数据源来创建地形瓦片。
全球数据
| 数据源 | 分辨率 | 缩放级别 | 备注 |
|---|---|---|---|
| Copernicus GLO‑30 | 30 m | z0 – z12 | ESA 全球 DEM |
全球数据集基于 ESA 的 Copernicus GLO‑30 模型,覆盖全球至 z12。
高分辨率数据
 {width=800}
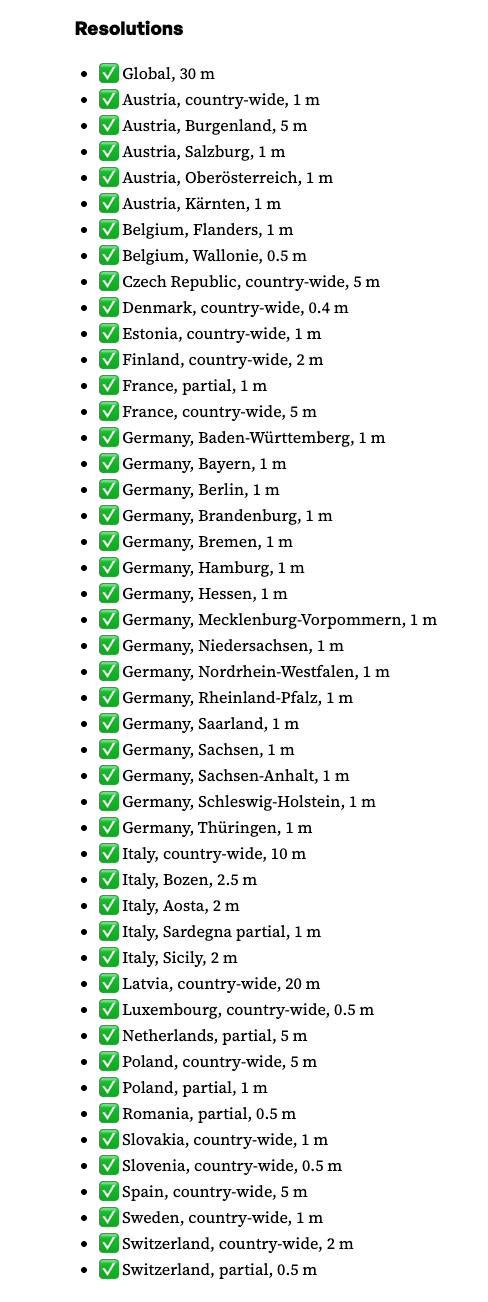
除了全球数据集,Mapterhorn 还提供来自多个欧洲国家的开放 DEM/LiDAR 源的高分辨率数据。
- 瑞士 – swisstopo 的 swissALTI3D(0.5 m 分辨率)
日本数据
更新(2025年12月): 已添加日本的高分辨率数据。
- ✅ 日本(全国) – 1 m、5 m、10 m
LinkedIn 公告:
Pull request adding the sources (replace with actual URL)
提前准备
执行环境
- Node v24.4.1
- npm v11.4.2
MapLibre GL JS 入门
Fork 或下载 starter 仓库并在本地运行。
仓库结构
maplibregljs-starter
├── dist
│   └── index.html
├── img
├── src
│   ├── main.ts
│   ├── style.css
│   └── vite-env.d.ts
├── README.md
├── LICENSE
├── index.html
├── package-lock.json
├── package.json
├── tsconfig.json
└── vite.config.ts
安装依赖
npm install          # install project dependencies
npm install pmtiles  # add the PMTiles library
package.json
{
  "name": "maplibregljs-starter",
  "version": "4.5.0",
  "description": "",
  "scripts": {
    "dev": "vite",
    "build": "tsc && vite build",
    "preview": "vite preview"
  },
  "keywords": [],
  "author": "MapLibre User Group Japan",
  "license": "ISC",
  "devDependencies": {
    "typescript": "^5.5.2",
    "vite": "^5.3.2"
  },
  "dependencies": {
    "maplibre-gl": "^4.5.0",
    "pmtiles": "^4.3.0"
  }
}
创建地图应用
下面的代码展示了如何使用 MapLibre GL 和 PMTiles 协议显示 Mapterhorn 地形数据。
- 将
src/main.ts的内容替换为以下代码。 - 使用
npm run dev启动开发服务器。 - 打开终端中打印的 URL(通常是
http://localhost:5173),即可看到带有阴影渲染的地形。
// src/main.ts
import './style.css';
import 'maplibre-gl/dist/maplibre-gl.css';
import maplibregl from 'maplibre-gl';
import { Protocol } from 'pmtiles';

// Enable the PMTiles protocol (metadata support is optional but useful)
const protocol = new Protocol({ metadata: true });

/**
 * Register a custom protocol (`mapterhorn://`) that resolves to PMTiles tiles.
 * The protocol extracts the z/x/y values from the URL, builds the PMTiles URL,
 * and asks the PMTiles library to fetch the tile.
 */
maplibregl.addProtocol('mapterhorn', async (params, abortController) => {
  const [z, x, y] = params.url
    .replace('mapterhorn://', '')
    .split('/')
    .map(Number);

  // Simple naming scheme – adjust if your PMTiles files follow a different convention.
  const name = `${z}-${x}-${y}`;

  // Build the PMTiles URL. The tile is stored as a WebP image inside the PMTiles file.
  const url = `pmtiles://download.mapterhorn.com/${name}.pmtiles/${z}/${x}/${y}.webp`;

  const response = await protocol.tile({ ...params, url }, abortController);

  if (response.data === null) {
    throw new Error(`Tile z=${z} x=${x} y=${y} not found.`);
  }

  return response;
});

// Initialise the MapLibre map
const map = new maplibregl.Map({
  container: 'map',
  hash: true,
  style: {
    version: 8,
    sources: {
      hillshadeSource: {
        type: 'raster-dem',
        tiles: ['mapterhorn://{z}/{x}/{y}'],
        encoding: 'terrarium',
        tileSize: 512,
        attribution: '[© Mapterhorn](https://mapterhorn.com/attribution)'
      }
    },
    layers: [
      {
        id: 'hillshade',
        type: 'hillshade',
        source: 'hillshadeSource'
      }
    ]
  },
  center: [138.7782, 35.3019], // Approx. Osaka, Japan
  zoom: 10
});

map.addControl(new maplibregl.NavigationControl());
运行应用
npm run dev开发服务器启动后,打开终端中显示的 URL(通常是 http://localhost:5173)。你应该能看到 Mapterhorn 地形以阴影渲染的方式可视化。
提示: 如果你的 PMTiles 命名规则与上述简单的
${z}-${x}-${y}模式不同,请在addProtocol中替换name的构建逻辑,以使用相应的计算方式。
添加导航控件
map.addControl(
  new maplibregl.NavigationControl({
    visualizePitch: true
  })
);
3‑D 地形渲染
MapLibre GL JS 的 terrain 功能使可视化 3‑D 地形变得容易。下面的示例展示了如何:
- 添加自定义
pmtiles协议用于栅格‑DEM 瓦片, - 加载栅格底图,
- 显示阴影和 3‑D 地形表面,
- 添加带有俯仰可视化的导航控件。
示例代码
// style.css is imported only for the page layout – it is not required for the map itself.
import './style.css';
import 'maplibre-gl/dist/maplibre-gl.css';
import maplibregl from 'maplibre-gl';
import { Protocol } from 'pmtiles';

// Initialise the PMTiles protocol (metadata is required for DEM tiles)
const protocol = new Protocol({ metadata: true });

/**
 * Custom protocol “mapterhorn” that resolves DEM tiles stored as PMTiles.
 * The tile URL format used by Mapterhorn is:
 *   pmtiles://https://download.mapterhorn.com/<name>.pmtiles/<z>/<x>/<y>.webp
 *
 * The <name> part is derived from the zoom level and the y‑coordinate.
 */
maplibregl.addProtocol('mapterhorn', async (params, abortController) => {
  const [z, x, y] = params.url
    .replace('mapterhorn://', '')
    .split('/')
    .map(Number);

  // Example naming scheme – adjust if your tile set uses a different pattern
  const name = `${z}-${y >> (z - 6)}`; // “z‑shifted‑y” pattern used by Mapterhorn

  const url = `pmtiles://https://download.mapterhorn.com/${name}.pmtiles/${z}/${x}/${y}.webp`;

  const response = await protocol.tile({ ...params, url }, abortController);
  if (response.data === null) {
    throw new Error(`Tile z=${z} x=${x} y=${y} not found.`);
  }
  return response;
});

// Create the map
const map = new maplibregl.Map({
  container: 'map',
  hash: 'map',
  style: {
    version: 8,
    sources: {
      // Basemap
      MIERUNEMAP: {
        type: 'raster',
        tiles: ['https://tile.mierune.co.jp/mierune/{z}/{x}/{y}.png'],
        tileSize: 256,
        attribution:
          'Maptiles by MIERUNE, under CC BY. Data by OpenStreetMap contributors, under ODbL.'
      },

      // DEM source (raster‑DEM)
      terrainSource: {
        type: 'raster-dem',
        tiles: ['mapterhorn://{z}/{x}/{y}'],
        encoding: 'terrarium',
        tileSize: 512,
        attribution: '[© Mapterhorn](https://mapterhorn.com/attribution)'
      }
    },

    layers: [
      { id: 'MIERUNEMAP', type: 'raster', source: 'MIERUNEMAP' },
      { id: 'hillshade', type: 'hillshade', source: 'terrainSource' }
    ],

    terrain: {
      source: 'terrainSource',
      exaggeration: 1.5
    }
  },

  center: [138.8016, 35.2395],
  zoom: 11,
  pitch: 60,
  bearing: -20
});

map.addControl(
  new maplibregl.NavigationControl({
    visualizePitch: true
  })
);
截图
| 描述 | 图片 |
|---|---|
| 带导航控件的地图 |  |
| 带 3‑D 地形的地图 |  |
提示: 调整 terrain 对象中的 exaggeration 值以适配你的视觉风格。数值越大,山脉看起来越陡;接近 1 的数值则以真实比例渲染地形。