使用 Python、Tkinter 和 MSS 构建屏幕捕获与 Scopes 工具
发布: (2026年1月9日 GMT+8 13:46)
8 分钟阅读
原文: Dev.to
Source: Dev.to
(未提供需要翻译的正文内容,故无法进行翻译。)
Source: …
实时屏幕捕获 GUI 与波形显示
在本教程中,我们将构建一个小型 GUI 工具,实时捕获屏幕并显示视频波形(矢量示波器、直方图和亮度图)。该应用还允许你选择感兴趣区域(ROI)、采样颜色并录制视频。
第 1 步 – 安装依赖
pip install tkinter ttkbootstrap numpy mss opencv-python pillow| 库 | 用途 |
|---|---|
| tkinter | 内置 GUI 框架 |
| ttkbootstrap | 现代、时尚的 Tkinter 小部件 |
| numpy | 高效数值数组 |
| mss | 快速屏幕捕获 |
| opencv‑python | 视频录制与图像处理 |
| pillow | 图像处理 |
第 2 步 – 创建主窗口
import ttkbootstrap as tb

APP_TITLE = "Scopes – Screen Capture"

app = tb.Window(title=APP_TITLE, themename="darkly", size=(1280, 720))
app.grid_columnconfigure(1, weight=1)   # 使第 1 列可伸缩
app.grid_rowconfigure(0, weight=1)      # 使第 0 行可伸缩
grid_columnconfigure / grid_rowconfigure 让窗口大小改变时画布能够扩展。
第 3 步 – 为控制面板和查看器布局框架
# 控制面板(左侧)
controls = tb.Frame(app, padding=10)
controls.grid(row=0, column=0, sticky="ns")

# 查看器面板(右侧)
viewer = tb.Frame(app)
viewer.grid(row=0, column=1, sticky="nsew")
viewer.grid_columnconfigure(0, weight=1)
viewer.grid_rowconfigure(0, weight=1)

# 用于绘制波形的 Canvas
import tkinter as tk
canvas = tk.Canvas(viewer, bg="black", highlightthickness=0)
canvas.grid(row=0, column=0, sticky="nsew")
Canvas 将用于显示矢量示波器、直方图和亮度图。
第 4 步 – 添加启动/停止和录制按钮
running   = False
recording = False

def toggle_capture():
    global running
    running = not running
    btn_start.config(text="Stop" if running else "Start")

btn_start = tb.Button(
    controls,
    text="Start",
    bootstyle="success",
    command=toggle_capture,
)
btn_start.pack(fill="x", pady=4)

def toggle_record():
    global recording
    recording = not recording
    btn_rec.config(text="Stop REC" if recording else "Record")

btn_rec = tb.Button(
    controls,
    text="Record",
    bootstyle="danger",
    command=toggle_record,
)
btn_rec.pack(fill="x", pady=4)toggle_capture切换 running 状态。toggle_record切换 recording 状态。
第 5 步 – 添加采样步长和增益滑块
tb.Label(controls, text="Sampling Step").pack(anchor="w")
sample_slider = tb.Scale(controls, from_=1, to=10, orient="horizontal")
sample_slider.set(4)
sample_slider.pack(fill="x")

tb.Label(controls, text="Gain").pack(anchor="w")
gain_slider = tb.Scale(controls, from_=1, to=10, orient="horizontal")
gain_slider.set(4)
gain_slider.pack(fill="x")
滑块让用户控制采样像素的数量以及矢量示波器的放大倍数。
第 6 步 – 将 RGB 转换为 YUV
import numpy as np

def rgb_to_yuv(rgb):
    """Convert an RGB image (0‑255) to YUV."""
    r, g, b = rgb[..., 0], rgb[..., 1], rgb[..., 2]
    y = 0.299 * r + 0.587 * g + 0.114 * b
    u = -0.147 * r - 0.289 * g + 0.436 * b
    v = 0.615 * r - 0.515 * g - 0.100 * b
    return y, u, v
波形通常在 YUV 色彩空间中可视化。
第 7 步 – 在 Canvas 上绘制波形
def draw_scopes(frame):
    """Render vectorscope, RGB histogram and luma histogram on the canvas."""
    canvas.delete("all")
    h, w, _ = frame.shape
    ch, cw = canvas.winfo_height(), canvas.winfo_width()

    step = int(sample_slider.get())
    gain = gain_slider.get()
    small = frame[::step, ::step] / 255.0          # down‑sample & normalise
    Y, U, V = rgb_to_yuv(small)

    # ---------- VECTORSCOPE --------
--
cx, cy, radius = 200, ch // 2, 160
canvas.create_text(cx, 20, text="VECTORSCOPE", fill="#aaa")
canvas.create_oval(cx - radius, cy - radius,
cx + radius, cy + radius,
outline="#444")
xs = cx + U.flatten() * radius * gain
ys = cy - V.flatten() * radius * gain
for x, y in zip(xs, ys):
canvas.create_line(x, y, x + 1, y, fill="lime")
# ---------- RGB HISTOGRAM ----------
hist_x = 420
hist_w = cw - hist_x - 20
hist_h = 150
hist_y = 60
canvas.create_text(hist_x, 20, text="HISTOGRAM",
fill="#aaa", anchor="w")
for i, col in enumerate(("red", "green", "blue")):
hist, _ = np.histogram(frame[..., i], bins=256, range=(0, 255))
hist = hist / hist.max() if hist.max() > 0 else hist
for x in range(256):
y0 = hist_y + hist_h
y1 = hist_y + hist_h - hist[x] * hist_h
canvas.create_line(hist_x + x * hist_w / 256, y0,
hist_x + x * hist_w / 256, y1,
fill=col)
# ---------- LUMA HISTOGRAM ----------
canvas.create_text(hist_x,
hist_y + hist_h + 30,
text="LUMA",
fill="#aaa",
anchor="w")
hist, _ = np.histogram((Y * 255).astype(np.uint8),
bins=256, range=(0, 255))
hist = hist / hist.max() if hist.max() > 0 else hist
for x in range(256):
y0 = hist_y + hist_h + 180
y1 = y0 - hist[x] * hist_h
canvas.create_line(hist_x + x * hist_w / 256, y0,
hist_x + x * hist_w / 256, y1,
fill="white")- Vectorscope – 显示 UV 平面上的颜色分布。
- RGB histogram – 按通道的强度分布。
- Luma histogram – 亮度分布。
Step 8 – 在后台线程中捕获屏幕
import threading, time, mss, cv2

latest_frame = None
video_writer = None
FPS = 30

def capture_thread():
    """持续抓取屏幕,更新 `latest_frame`,并在录制时写入视频文件。"""
    global latest_frame, video_writer
    with mss.mss() as sct:
        monitor = sct.monitors[1]          # 主显示器
        while True:
            if running:
                # 抓取屏幕,去掉 alpha 通道
                img = np.array(sct.grab(monitor))[:, :, :3]
                latest_frame = img

                # 录制时写入视频
                if recording:
                    h, w = img.shape[:2]
                    if video_writer is None:
                        fourcc = cv2.VideoWriter_fourcc(*"mp4v")
                        video_writer = cv2.VideoWriter(
                            "capture.mp4", fourcc, FPS, (w, h)
                        )
                    video_writer.write(cv2.cvtColor(img, cv2.COLOR_RGB2BGR))
                else:
                    # 录制结束时停止并释放写入器
                    if video_writer is not None:
                        video_writer.release()
                        video_writer = None
            else:
                # 未运行时稍作休眠
                time.sleep(0.1)

            # 按目标 FPS 刷新画布
            if latest_frame is not None:
                draw_scopes(latest_frame)
                canvas.update_idletasks()
                canvas.update()
            time.sleep(1 / FPS)

# 启动捕获线程
thread = threading.Thread(target=capture_thread, daemon=True)
thread.start()
该线程:
- 当 running 为
True时捕获屏幕。 - 将最新帧存入
latest_frame。 - 当 recording 为
True时将帧写入capture.mp4。 - 调用
draw_scopes()以在所需帧率下更新 GUI。
Step 9 – 运行应用程序
if __name__ == "__main__":
    app.ma
inloop()
Press **Start** to begin live capture, **Record** to save a video, and adjust the sliders to change sampling density and vectorscope gain.

**Enjoy experimenting with real‑time scopes!** 🎥✨
屏幕捕获与示波器工具 – 清理后的 Markdown
第8步:写入视频帧(可选)
if video_writer is None:
    video_writer = cv2.VideoWriter(
        "recording.mp4",
        cv2.VideoWriter_fourcc(*"mp4v"),
        FPS,
        (w, h)
    )
if video_writer.isOpened():
    video_writer.write(cv2.cvtColor(img, cv2.COLOR_RGB2BGR))

time.sleep(1 / FPS)
启动捕获线程
threading.Thread(target=capture_thread, daemon=True).start()第9步:更新 UI 循环
Tkinter 不喜欢在主线程中进行大量计算,所以我们定期更新画布:
def update_ui():
    if running and latest_frame is not None:
        draw_scopes(latest_frame)
    app.after(33, update_ui)   # ~30 FPS

update_ui()
第10步:添加 ROI 与颜色采样
roi = None
start_pt = None
color_indicators = []

def on_mouse_down(e):
    global start_pt
    start_pt = (e.x_root, e.y_root)

def on_mouse_up(e):
    global roi, start_pt
    if not start_pt:
        return
    x1, y1 = start_pt
    x2, y2 = e.x_root, e.y_root
    roi = (min(x1, x2), min(y1, y2), max(x1, x2), max(y1, y2))
    start_pt = None

canvas.bind("<ButtonPress-1>", on_mouse_down)
canvas.bind("<ButtonRelease-1>", on_mouse_up)

def on_key(e):
    global roi
    if e.keysym == "Escape":
        app.destroy()
    if e.keysym == "space":
        import mss
        x, y = app.winfo_pointerxy()
        with mss.mss() as sct:
            img = sct.grab(sct.monitors[1])
            r, g, b = img.pixel(x, y)
            color_indicators.append((r/255, g/255, b/255))
    if e.keysym == "r":
        roi = None

app.bind("<Key>", on_key)
控制
| 操作 | 键位 / 鼠标 |
|---|---|
| 定义 ROI(拖动) | 鼠标拖动 |
| 在光标处采样颜色 | Space |
| 退出 | Esc |
| 重置 ROI | R |
第11步:运行应用程序
app.mainloop()✅ 完成! 现在你拥有一个完整可用的 Python 屏幕捕获与示波器工具。你可以:
- 开始/停止捕获
- 录制视频
- 分析颜色
调整采样率和增益以微调示波器。
示例输出
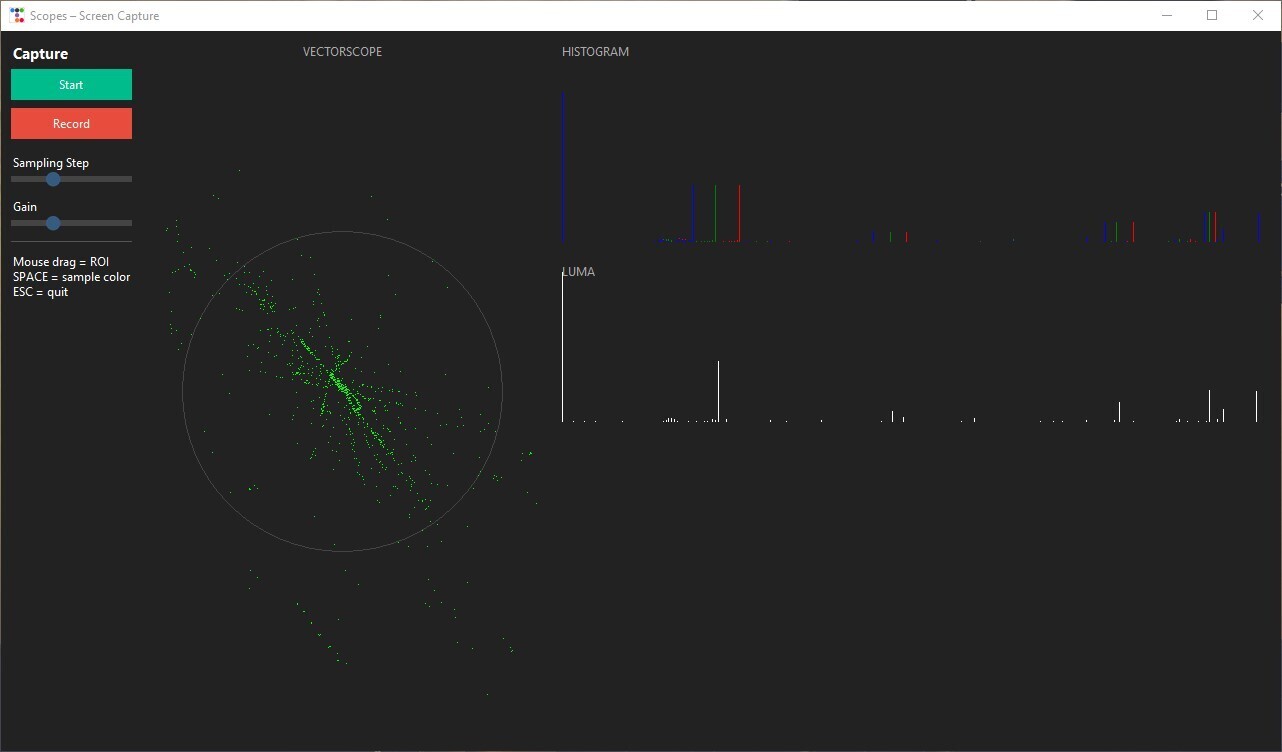 (点击图片查看更大图)