What Really Happens When an LLM Chooses the Next Token🤯
Source: Dev.to
The Core Idea
Given a prompt, the model predicts a probability distribution over possible next tokens.
For example:
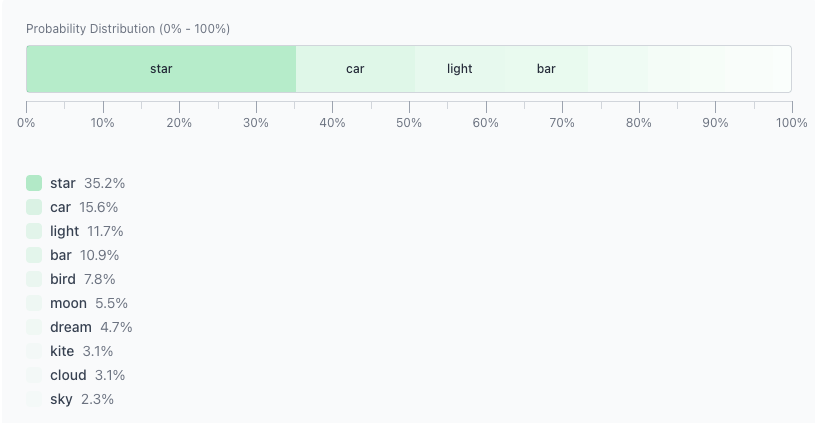
Twinkle twinkle littleAt this point, the model assigns a probability to each candidate token. You can imagine them laid out on a 0–100 scale:
- Higher probability → larger segment
- Lower probability → smaller segment
Sampling: What Actually Happens
Next comes sampling. A practical way to think about it:
- Generate a random number.
- See which segment it falls into.
- Output the corresponding token.
Since “star” has the largest segment, it’s the most likely result:
Twinkle twinkle little starTemperature, Top‑p, and Top‑k only affect this sampling step.
From here on we’ll use the defaults:
- Temperature = 1
- Top‑p = 1
- Top‑k = 10
and change one parameter at a time.
Temperature
Temperature does one thing: it stretches or flattens probability differences.
- Lower temperature → strong preferences → stable output
- Higher temperature → flatter distribution → more randomness
In this example the gap between “star” and “car” is 19.6.
- With Temperature = 0.5, the gap grows to 36.1.
- With Temperature = 1.68, lower‑probability tokens become more competitive.
Key point: Temperature doesn’t remove tokens; it only changes how strongly the model prefers one over another.
Top‑p (Nucleus Sampling)
Top‑p controls how much probability mass is kept. The process is straightforward:
- Start from the highest‑probability token.
- Keep adding tokens until cumulative probability ≥ Top‑p.
- Drop the rest.
With Top‑p = 0.6, only tokens covering 60 % of total probability remain.
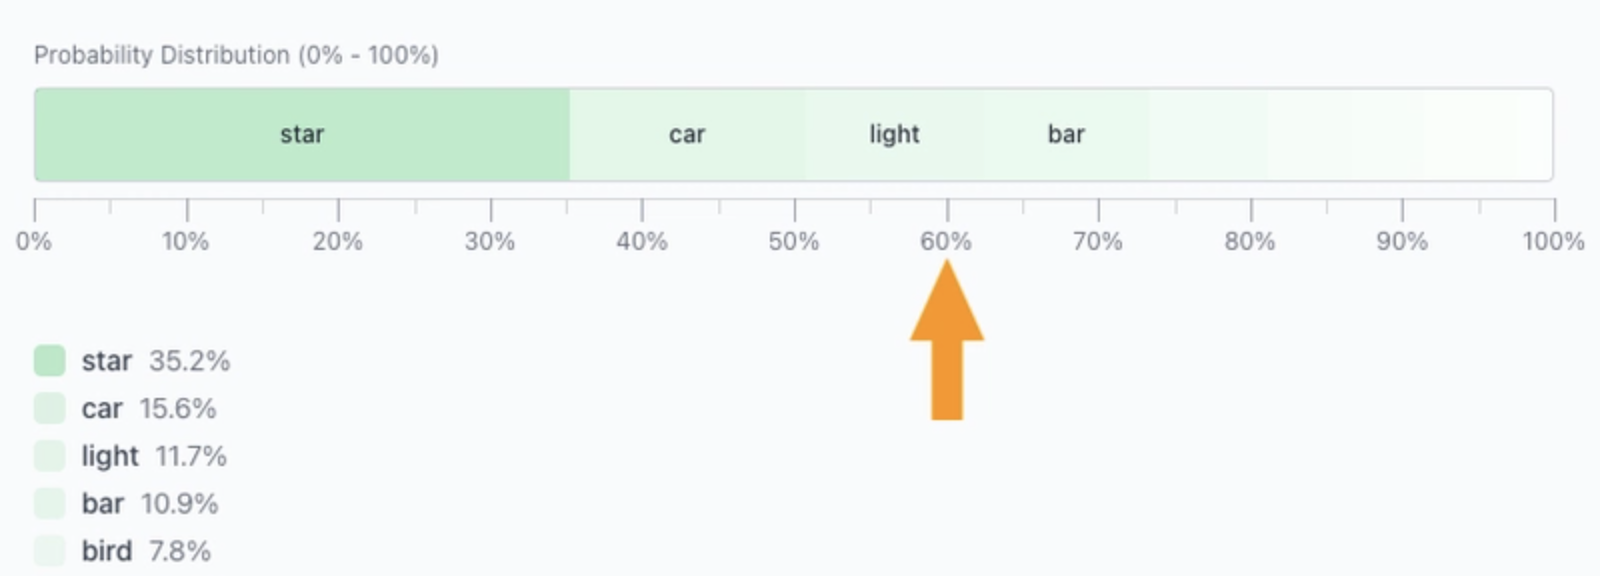
The remaining tokens are then renormalized:
- The number of tokens is dynamic.
- More peaked distributions keep fewer tokens.
Top‑k
Top‑k is simpler: keep only the top K tokens.
- Top‑k = 1 → always pick the most likely token.
- Top‑k = 5 → sample from the top 5.
- Everything else is ignored.
In one line:
- Top‑k limits quantity.
- Top‑p limits probability mass.
Demo
All visuals in this article come from the LLM Sampling Visualizer:
👉
If sampling parameters feel abstract, five minutes with this tool builds intuition faster than reading more text.