Strategies to Avoid Redrawing Diagrams in Technical Work
Source: Dev.to
TL;DR – Strategies to Avoid Redrawing Diagrams
- Use modular, reusable diagram frameworks to save time.
- Standardize shapes, colors, and layouts for clarity and consistency.
- Implement version control to prevent repeated edits.
- Leverage AI‑powered tools for diagram generation and updates.
- Break complex ideas into separate visuals to streamline workflows.
Why Consultants Are Stuck Redrawing the Same Visuals
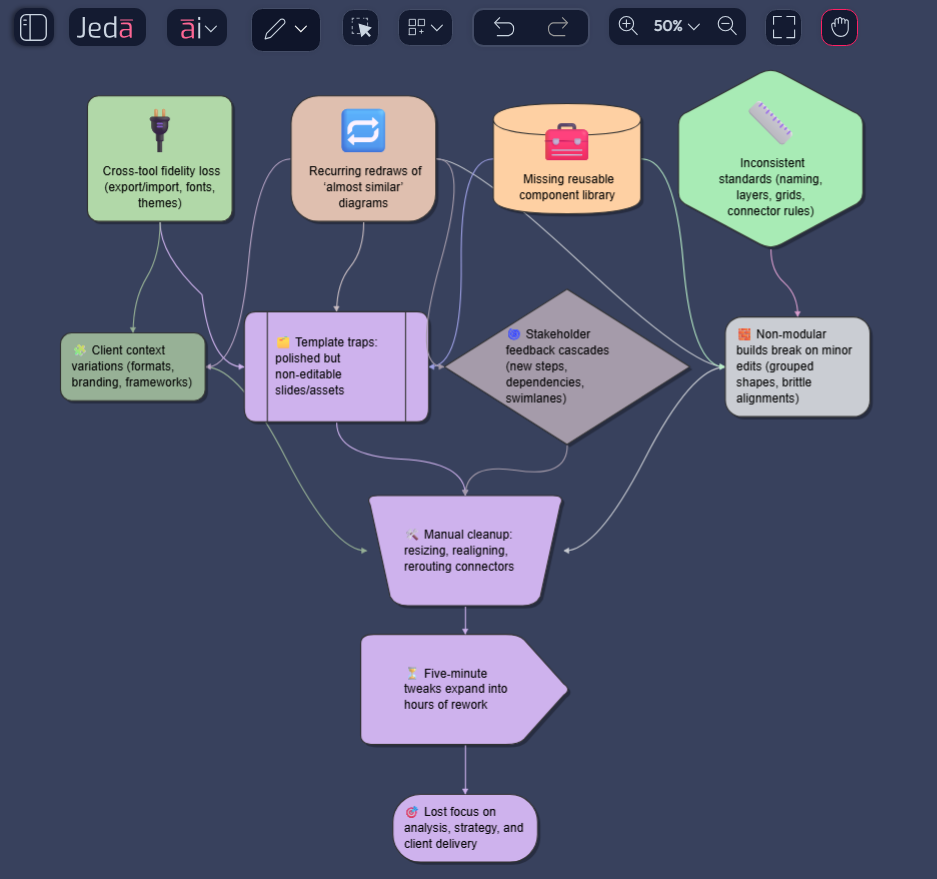
If you’ve ever rebuilt the same flowchart for the third time, you know the frustration. Each new client brings slightly different contexts, formats, and expectations—forcing consultants to modify visuals instead of reusing them. That “almost similar” diagram ends up needing a full makeover.
Requirements shift fast in consulting. One round of stakeholder feedback can trigger cascading changes, extra steps, new dependencies, altered swimlanes—each forcing another redraw. When diagrams aren’t built modularly, even tiny updates break everything around them.
And then there are “template traps,” where pre‑existing slides look polished but aren’t actually editable. Consultants waste hours adding shapes, resizing arrows, and trying to fit new content into outdated structures. What should be a streamlined process becomes a visual puzzle every single time.
How Redrawing Harms Consulting Outcomes
The danger isn’t just inefficiency—it’s misalignment. Inconsistent diagrams across workshops and deliverables lead to misinterpretation, causing teams to revisit conversations they thought were settled. Visual gaps often become communication gaps.
As diagrams go through multiple revisions, clarity slowly erodes. Elements shift, proportions stretch, colors drift, and before long the visual loses the crisp logic it originally carried. Quality dilution happens quietly but impacts how recommendations are understood.
This pressure often falls hardest on junior consultants. They’re the ones staying late, recreating frameworks, adjusting connectors, and cleaning decks before deadlines. On top of their core analysis work, manual diagram recreation becomes a bottleneck that slows both individual and team performance.
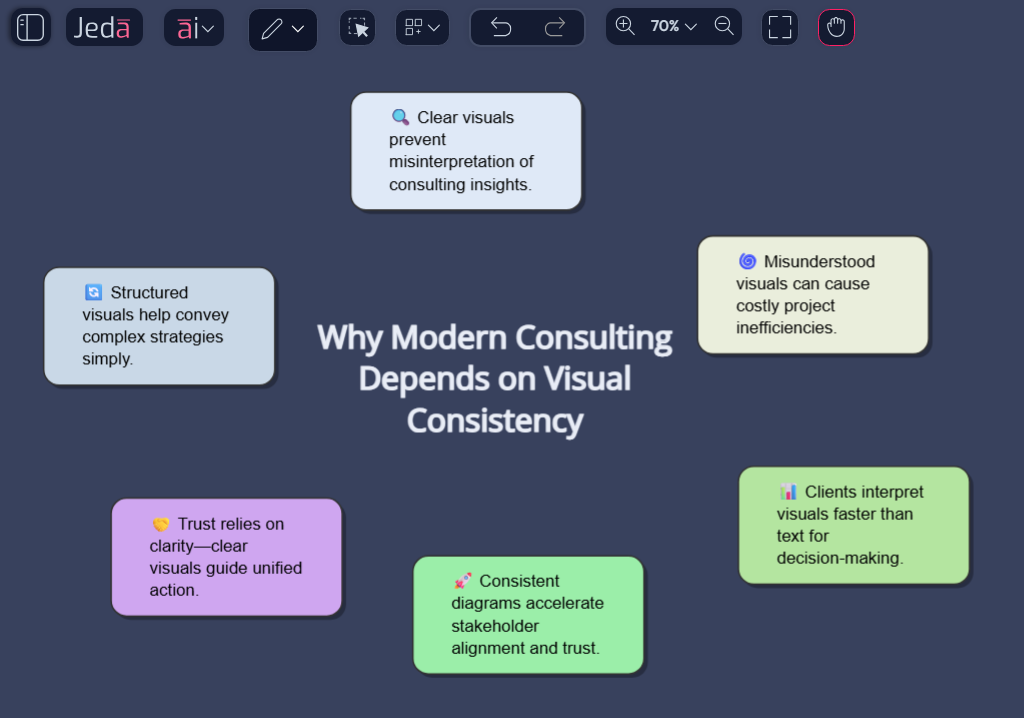
Why Modern Consulting Depends on Visual Consistency
A single unclear diagram can quietly derail an entire consulting engagement. Clients move fast and rarely read every word, but they always stop to interpret visuals. That moment determines whether your message lands. When consulting deliverables lack structured, clear visuals, decisions stall and conversations drift off‑track.
Stakeholders rely heavily on diagrams to understand direction, risk, and the logic behind recommendations. When visuals are inconsistent or overloaded, teams lose confidence in the narrative. Business‑strategy visuals should support alignment, not introduce friction. Yet many consultants struggle to turn complex thinking into simple, intuitive flows.
Misinterpretation is the most expensive form of inefficiency. A small diagram misunderstanding can ripple through project plans, budgets, or prioritization models. The cost isn’t just time—it’s trust. Clear consulting framework diagrams help teams move in the same direction without constant clarification or repeated walkthroughs.
The Increasing Pressure for High‑Fidelity, High‑Volume Visuals
Consulting has become a visual sport, and expectations rise every quarter. Engagement timelines are shorter, stakeholders are busier, and project scopes continue expanding. This means consultants must deliver polished diagrams faster than ever—from data flows to operating models to stakeholder‑alignment tools.
Workflows themselves are more complex today: digital transformations, multi‑team operations, cross‑functional systems, and technical integrations. Visualizing these moving pieces requires precision and structure. Consultants often produce dozens of variations: one for leadership, one for operators, one for implementation teams, and another for documentation.
Every engagement now demands repeatable slides, reusable frameworks, and tightly aligned process maps. Yet most teams start from scratch each time, creating a cycle of unnecessary rebuilding. This pressure leaves consultants feeling like they’re always designing instead of analyzing, slowing momentum across the entire engagement.
Where Consultants Waste the Most Time
The biggest time sink in consulting isn’t analysis—it’s diagram rework. Hours disappear into recreating past diagrams because the original files weren’t built for reuse. Without consistent structure, consultants fall into the trap of rebuilding visuals instead of refining insights.
Another hidden drain is what many call “diagram chaos”: multiple contributors editing diagrams in different styles, sizes, fonts, and structures. Cleaning these inconsistencies is tedious but unavoidable when teams lack shared visual standards. This administrative work adds no value, yet it consumes enormous capacity in fast‑paced projects.
Branding adds yet another layer of friction. Manually applying client colors, line weights, and typography slows production. When each new engagement requires custom visuals, consultants end up designing instead of consulting. These inefficiencies compound, turning simple diagrams into multi‑hour tasks.
The Core Problem to Solve: Redrawing Redesigning
It hits you the moment a client requests a “tiny update” and the whole diagram falls apart. Most consulting visuals aren’t built for reuse or scalable diagram design. Instead, they rely on thousands of disconnected shapes, non‑editable screenshots, and structures held together by luck, not logic. Without naming systems or shared diagram templates, even small edits turn into full rebuilds.
The Skill Gap No One Talks About
The tough truth? Many business consultants and project teams are brilliant thinkers but were never trained in visual design fundamentals, modular diagram construction, or systematic version control. This gap fuels the endless cycle of redrawing and hampers the ability to deliver consistent, high‑quality visuals at speed.