SEMNR: Why I Stopped Trusting 'Clean' Images (And Treated Metrics as Guardrails)
Source: Dev.to
This work was carried out as part of an intensive Applied Materials & Extra‑Tech bootcamp, where the challenge went far beyond choosing the “right” denoising model.
I would like to thank my mentors Roman Kris and Mor Baram from Applied Materials for their technical guidance, critical questions, and constant push toward practical, production‑level thinking, as well as Shmuel Fine and Sara Shimon from Extra‑Tech for their support and teaching throughout the process.
Why “Clean” Is Not Enough in SEM Denoising
In classical image processing, clean is a compliment.
In semiconductor SEM denoising, clean is often a lie.
The obvious goal of a denoiser is to remove noise, but in scientific and industrial imaging the real objective is evidence preservation. Microscopic edges of a conductor, the subtle texture of a silicon surface, or a tiny defect—these signals carry critical meaning.
A denoiser can easily make an image look pleasant to the human eye while silently scrubbing away the very details that change the entire analysis.
Building SEMNR taught me a hard lesson: standard evaluation methods were a trap. I didn’t need a leaderboard to brag about; I needed engineering guardrails. Below is how I moved from chasing high scores to building a trust profile for my data.
High Score vs. High Trust
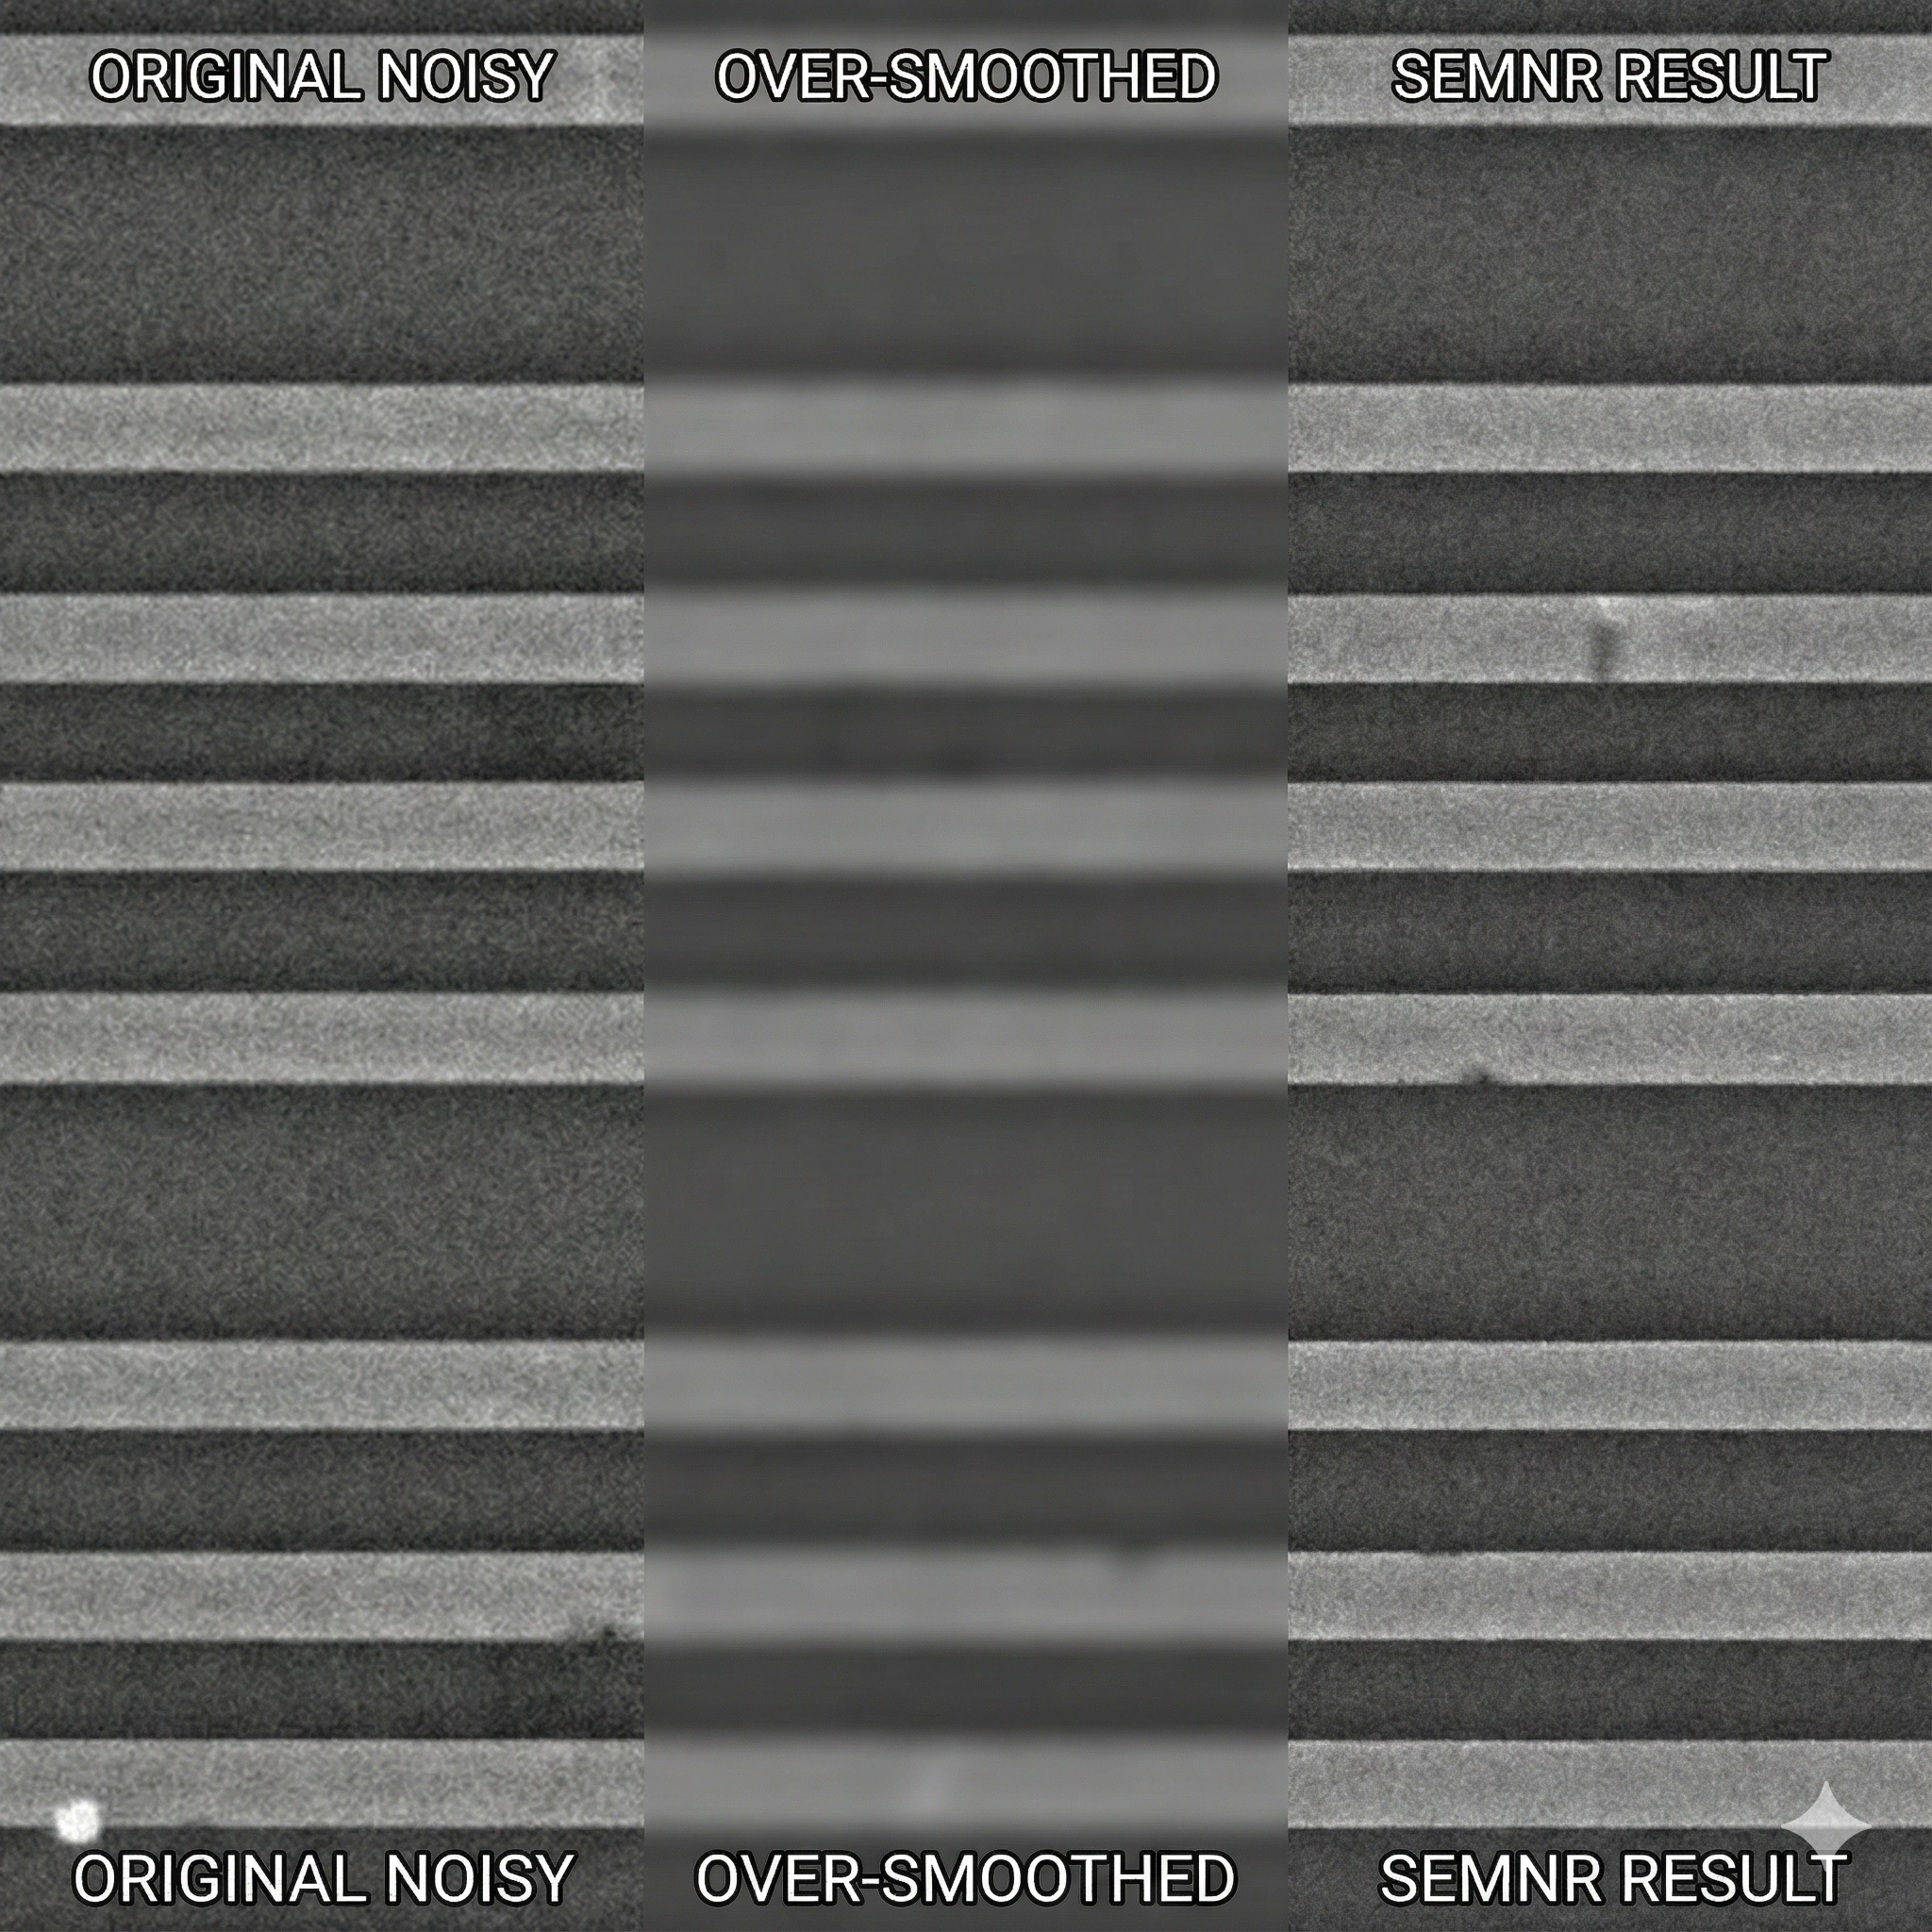
The middle image has a higher PSNR score but blurs the critical edges of the wafer lines. The right image (SEMNR) preserves the sharp structure and original texture, even if it looks less “clean”.
Defining What I Refuse to Lose
Before training a single model, I defined exactly what I refused to lose. Metric selection became an active engineering decision, not just a passive acceptance of default tools.
I found that aggressive noise reduction often fights directly against preserving structure:
- Metrics that reward smoothness (e.g., standard PSNR) actively encourage over‑smoothing. The model learns to blur textures just to get a better score by minimizing pixel error.
- Metrics that ignore texture essentially give the model permission to hallucinate details that aren’t there—or, worse, wipe out real defects critical for quality control.
To validate this, I ran “stress tests” (artificial blur, over‑sharpening, and added artifacts) on SEM samples and observed which metrics flagged issues. The results were wildly inconsistent: PSNR often improved while the image became less analytically useful. That instantly killed the “single hero number” idea for me.
The Stack: Profiles Over Scores
Instead of chasing one perfect number, I built a metric profile—a QA toolkit where each metric has a specific job description.
Metric Profile Overview
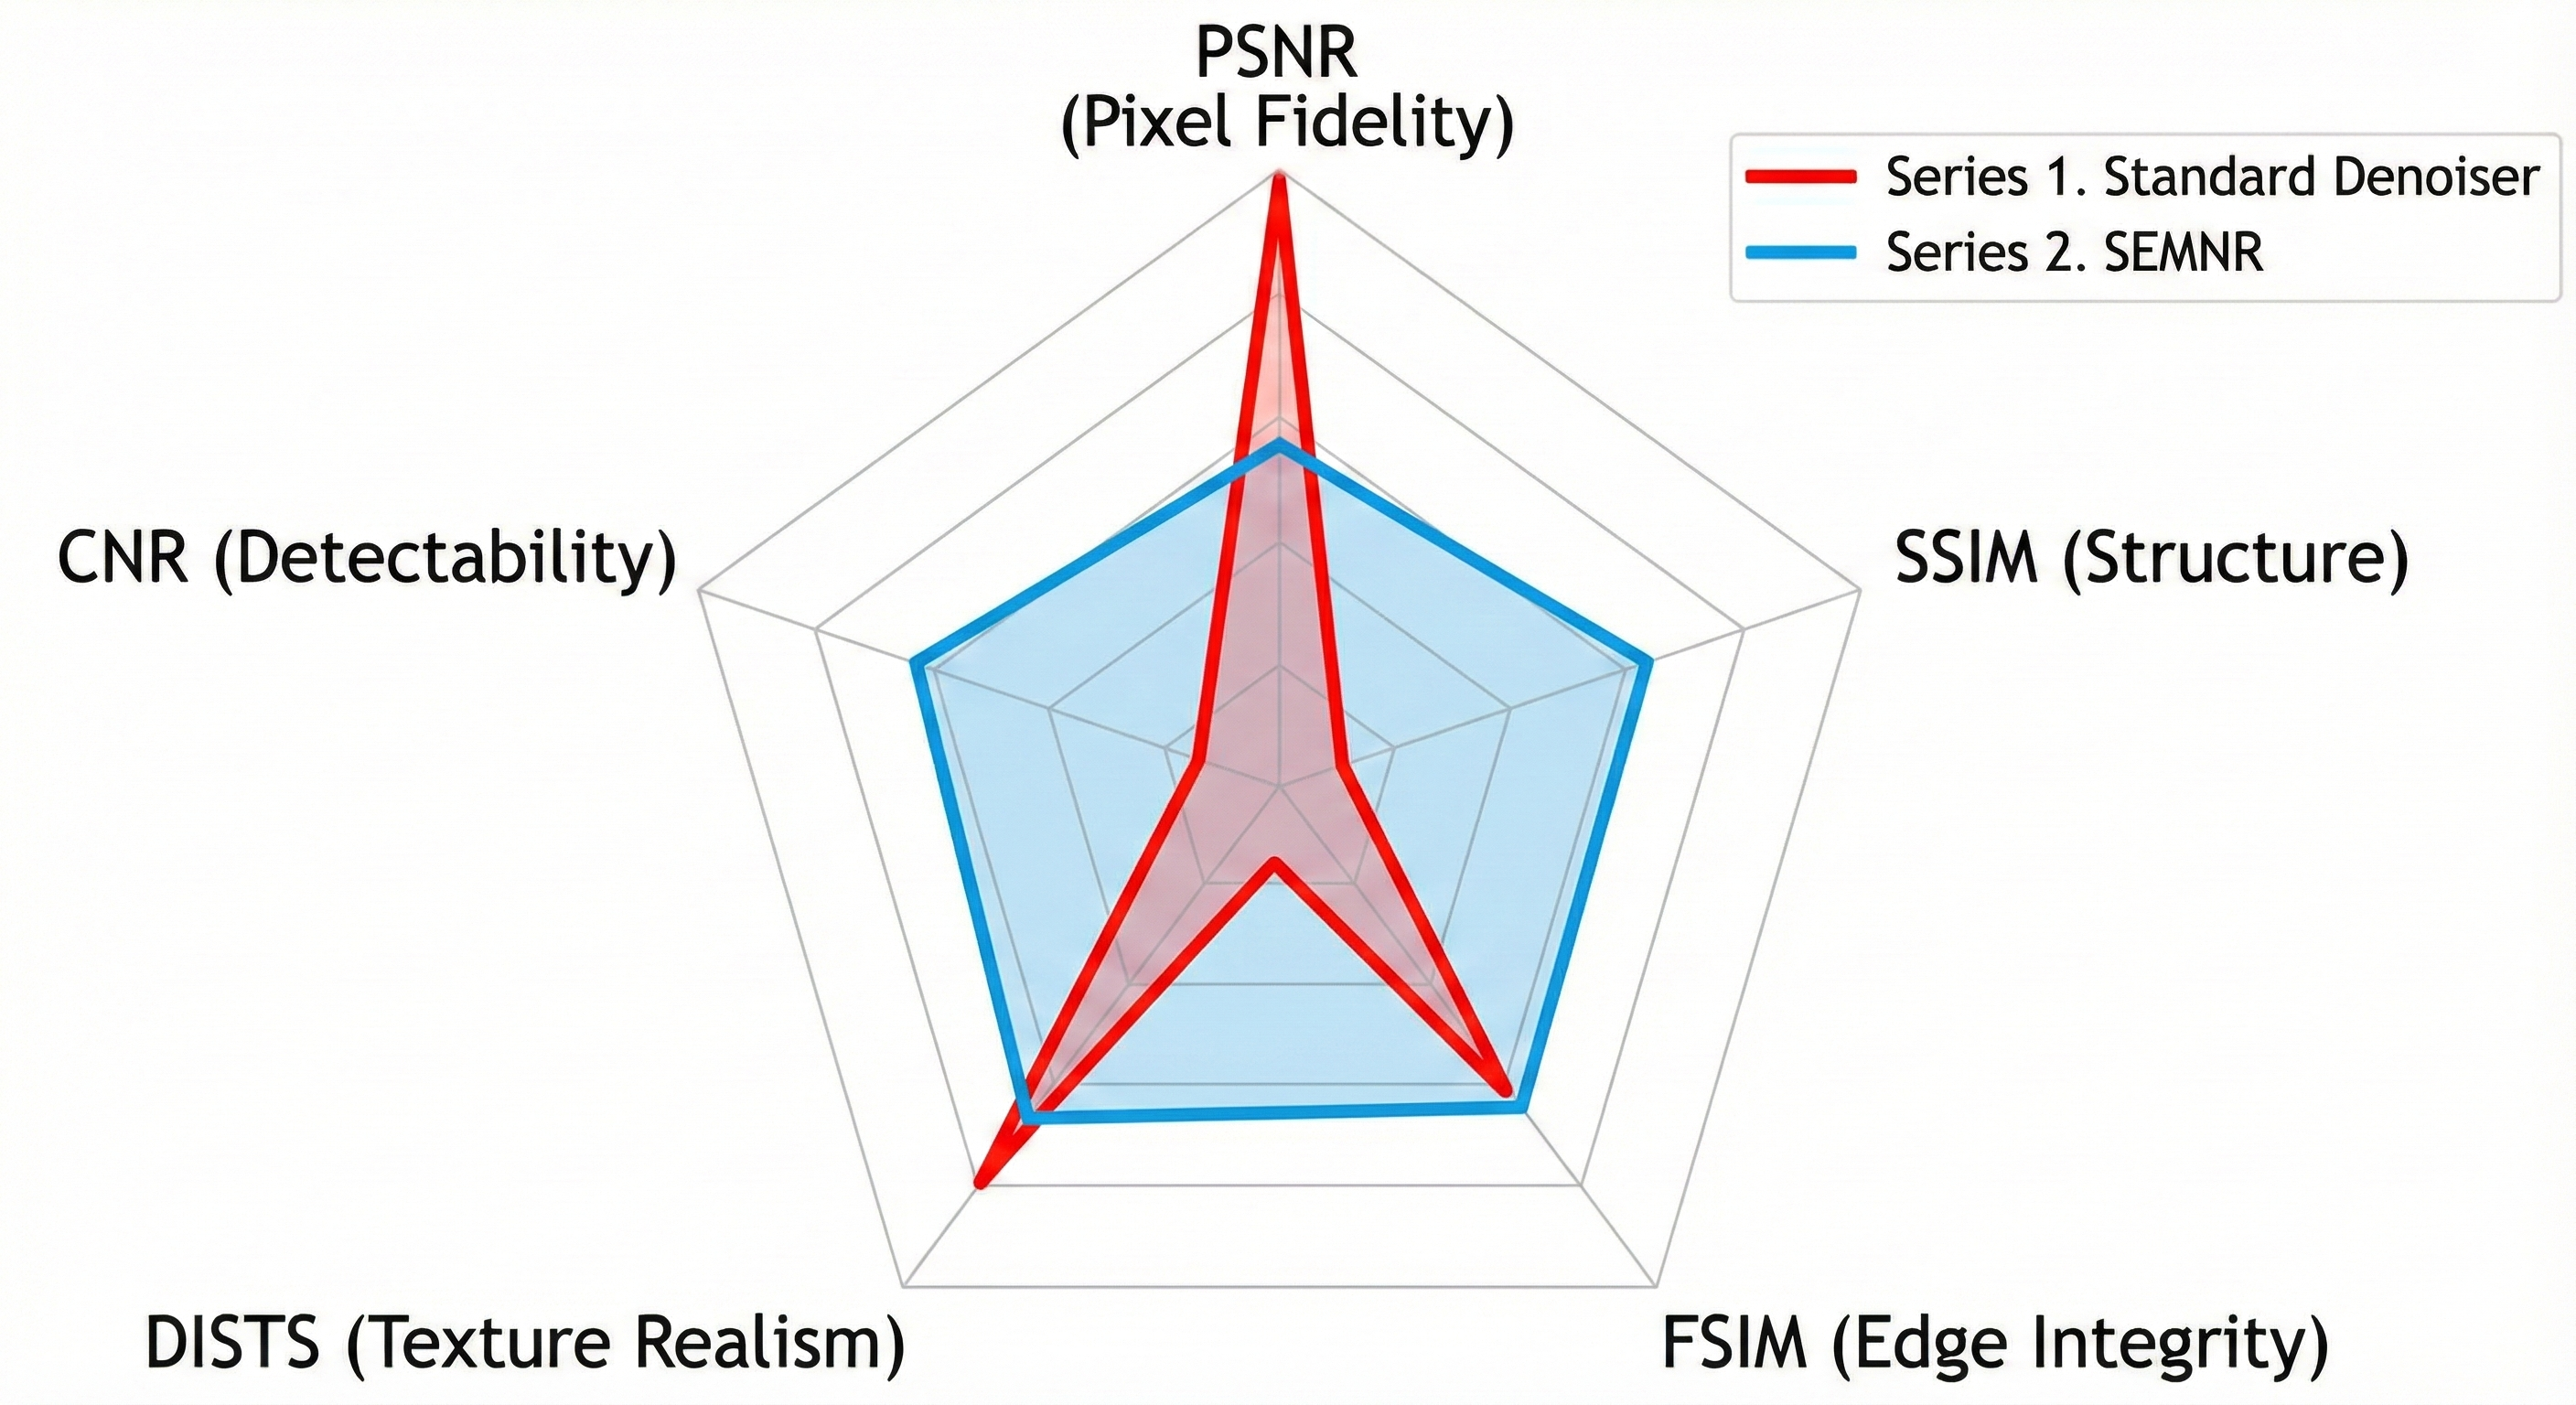
The goal is to maximize the total area of the chart, not just one spike. Notice how boosting PSNR (Fidelity) often comes at the direct expense of Texture Realism (DISTS).
| Metric | Role | What It Captures |
|---|---|---|
| PSNR | The Anchor | Pixel‑level fidelity (how close raw pixel values are to the original). Baseline, but never trusted alone. |
| SSIM | The Structural Engineer | Preservation of macroscopic structures (e.g., contact holes, vias). |
| FSIM | The Edge Guardian | Sharp transitions between materials; flags blurred edges—critical for SEM. |
| DISTS | The Texture Specialist | Deep‑learning‑based texture realism; prevents a “plastic” look and preserves natural grain. |
| CNR | The Pragmatist | Practical contrast‑to‑noise detectability; asks whether a computer‑vision algorithm can still spot defects. |
Where Metrics Disagree – Finding the Debug Signals
The most valuable engineering insights arrived when metrics disagreed. I learned to read these conflicts as distinct debugging signals for model behavior:
- PSNR ⬆️ / FSIM ⬇️ – Over‑smoothing: the model is aggressively cleaning noise but erasing high‑frequency edge information.
- SSIM Stable / DISTS ⬇️ – Texture drift: overall structure is fine, but the surface is losing its authentic material character.
- PSNR ⬆️ / CNR ⬇️ – Contrast loss: pixel values are closer to ground truth, yet local contrast has dropped, making features harder to interpret.
Conflict‑Resolution Flowchart

The flowchart I used to flag failures and guide debugging decisions.
Takeaways
- One metric ≠ truth – Relying on a single number (e.g., PSNR) can hide critical degradations.
- Build a profile – Combine complementary metrics to capture fidelity, structure, edge preservation, texture, and practical detectability.
- Listen to conflicts – Disagreements between metrics are the most informative signals; they point directly to the type of artifact the model is introducing.
- Trust over score – In scientific imaging, the goal is a trustworthy representation of reality, not a high‑scoring but misleading image.
If you’re working on SEM or any other scientific imaging pipeline, consider adopting a multi‑metric trust profile. It will save you from the false comfort of “clean” images that have silently lost the evidence you need.
## Closing: Shifting from Beauty to Trust
In **SEMNR**, this process changed my guiding question from *“Is this image clean?”* to **“Is this image trustworthy?”**
By building an evaluation stack that uses specific metrics as guardrails against specific failures (like edge blurring), I turned model evolution from a beauty contest into an engineering safety system.
In the world of scientific and industrial data, my job isn’t to beautify reality, but to reveal it with minimal interference. Sometimes, that means leaving a little bit of natural *“noise”* behind—just to make sure the truth stays in the picture.
[](https://media2.dev.to/dynamic/image/width=800,height=,fit=scale-down,gravity=auto,format=auto/https%3A%2F%2Fdev-to-uploads.s3.amazonaws.com%2Fuploads%2Farticles%2Fikedyghj7e3xd8l62v1a.png)
*The difference is in the micro‑details: a zoom‑in on a defect at the edge of a structure.
Left: a standard model erased the defect along with the noise.
Right (SEMNR): the noise is cleared, but the critical defect is preserved sharply.*