Schemas and data modelling in Power BI
Source: Dev.to
What is a Schema in Power BI?
A data schema is a structure that defines the relationships of data in a database or other data‑storage system.
Schemas define how data is connected and related within the model, influencing the efficiency and performance of data queries and reports. Understanding schemas helps in designing best‑practice data models that support comprehensive analysis.
Types of Schemas in Power BI
1. Star Schema
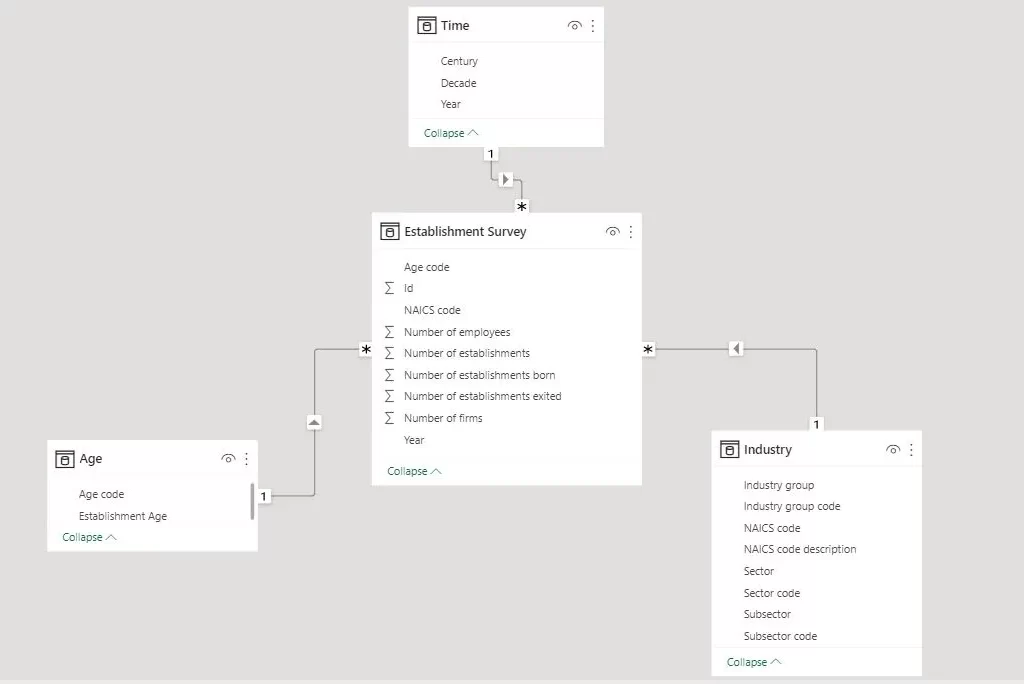
Definition – The star schema is a simple and commonly used schema in data warehousing. It consists of a central fact table surrounded by dimension tables, forming a star‑like pattern.
Structure – The central fact table contains quantitative data (e.g., sales), while the dimension tables hold descriptive attributes related to the facts (e.g., Employee, Date, Territory).
Use Cases – Star schemas are ideal for straightforward reporting and querying. They are efficient for read‑heavy operations, making them suitable for dashboards and summary reports.
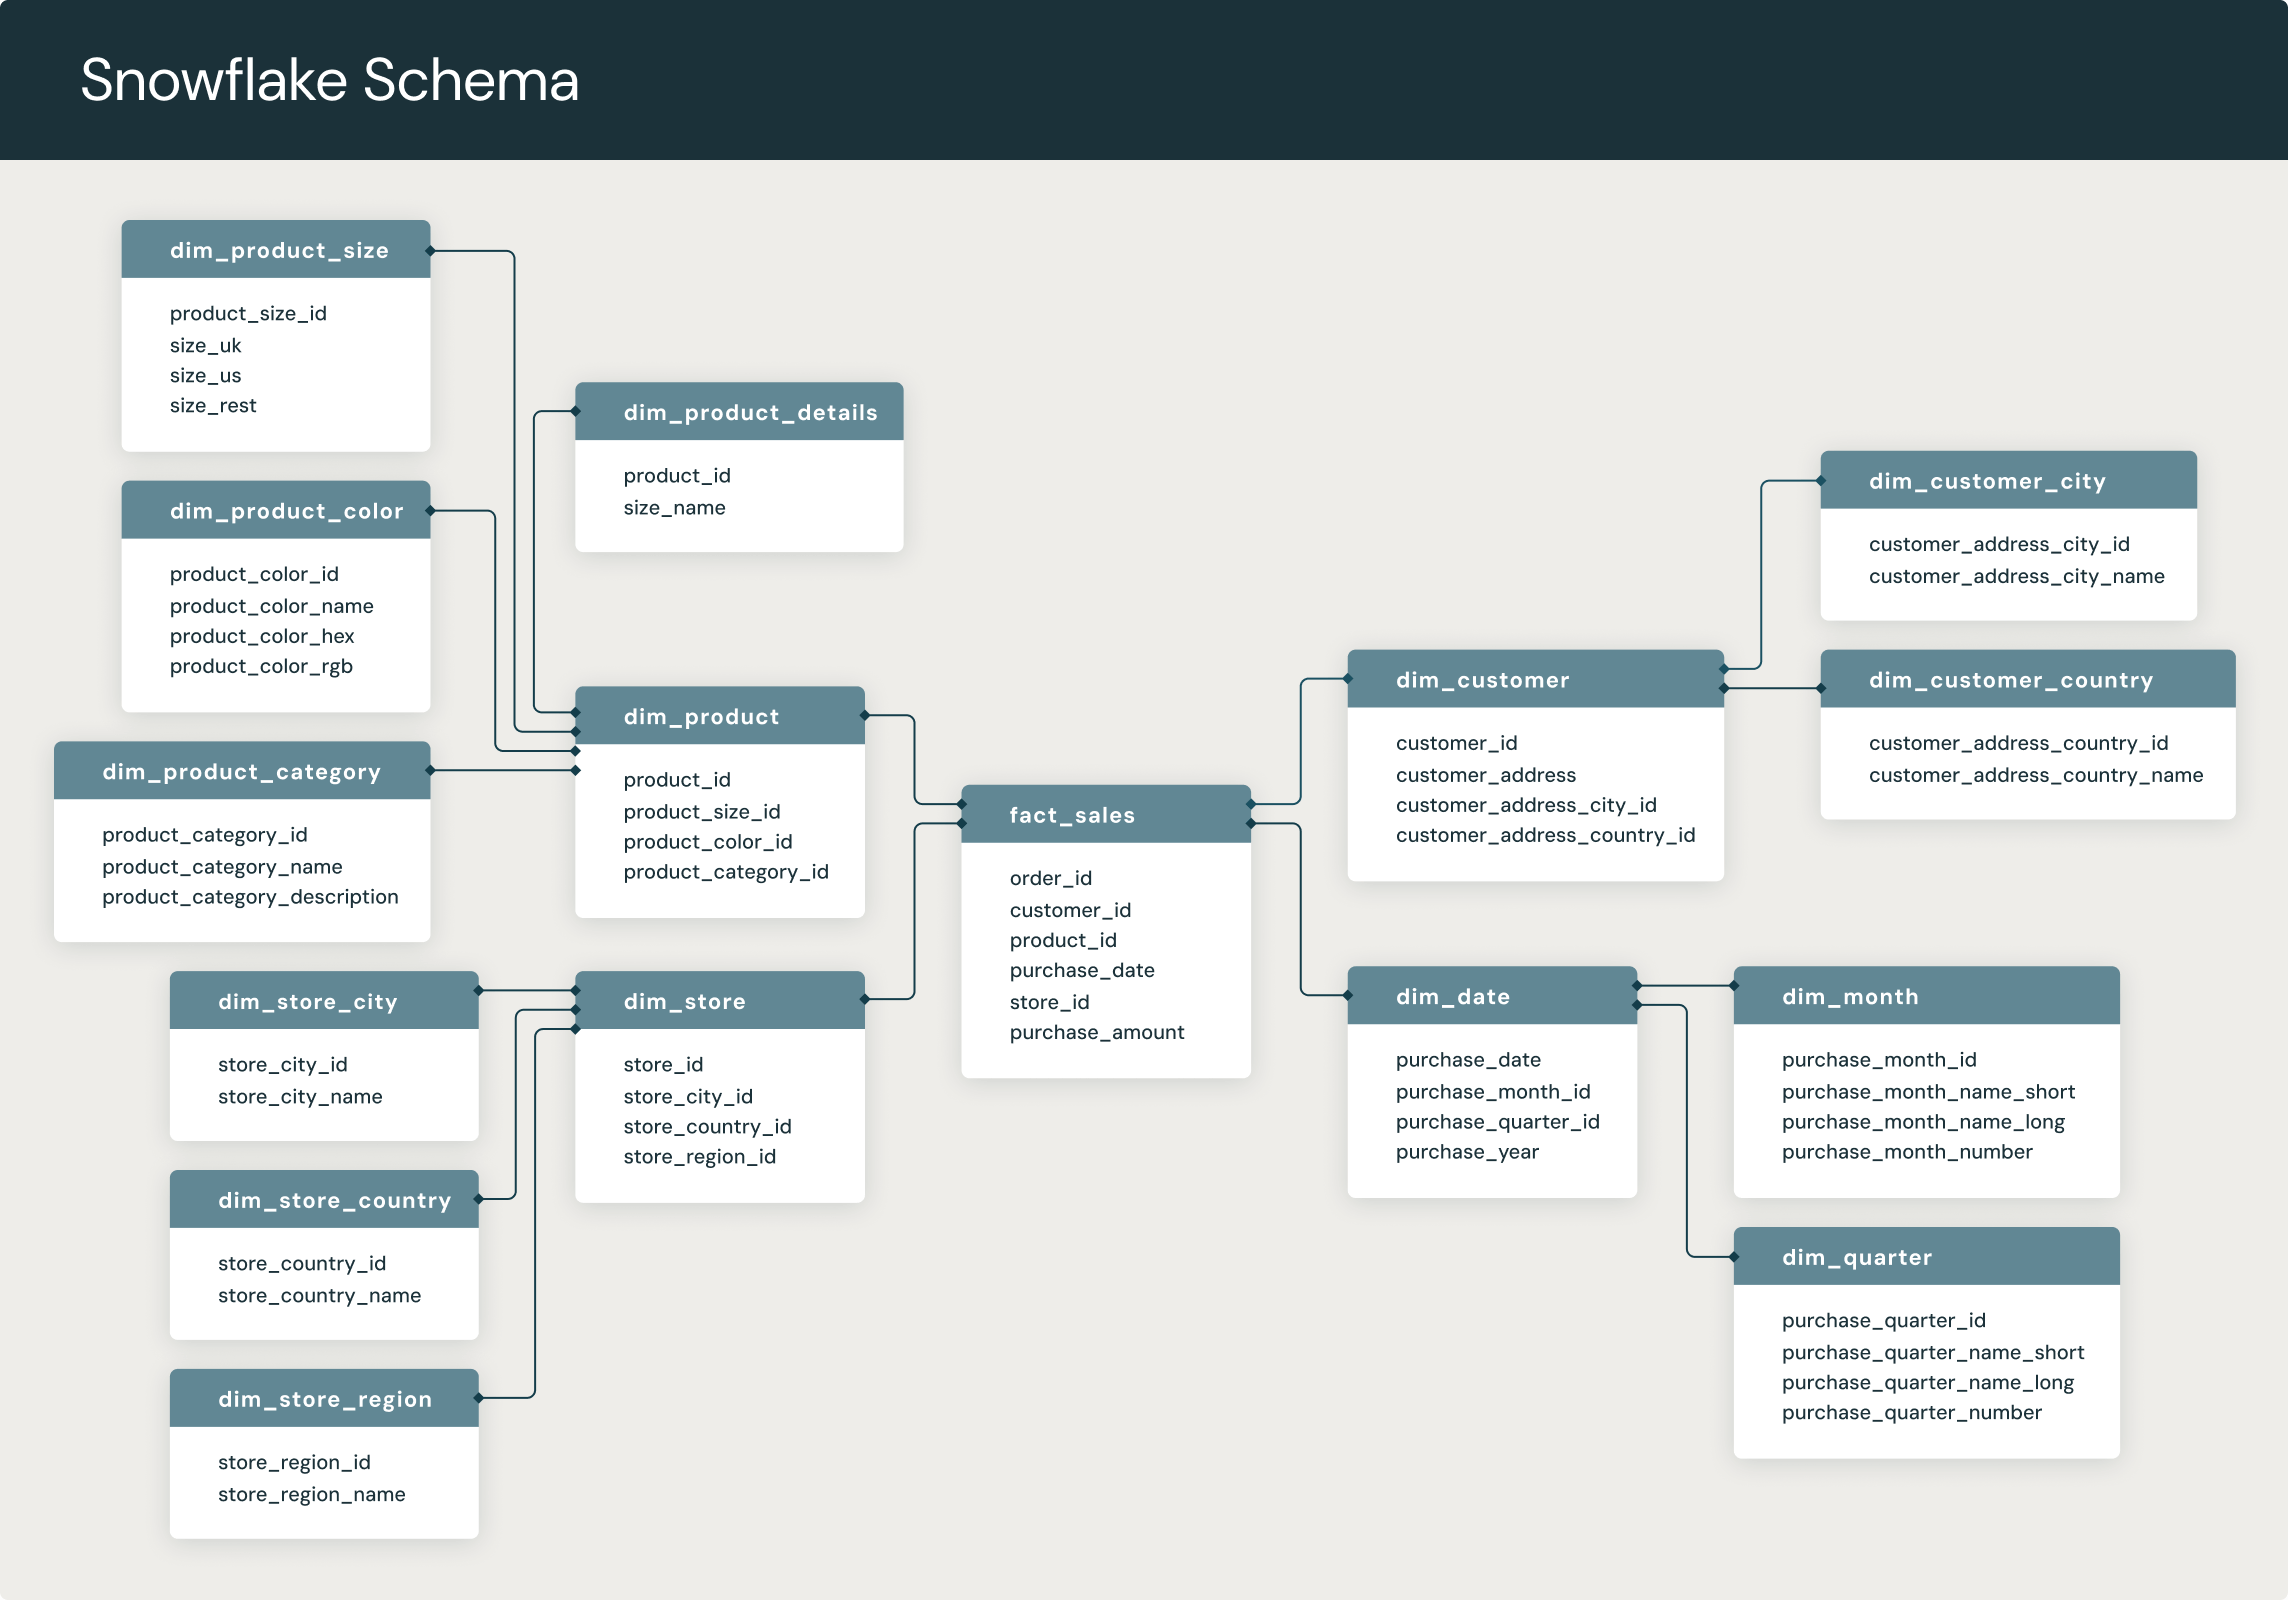
2. Snowflake Schema
Definition – The snowflake schema is a normalized version of the star schema. In this design, dimension tables are further divided into related tables, resulting in a more complex structure.
Structure – The normalization process eliminates redundancy by splitting dimension tables into multiple related tables. This results in a web‑like structure, resembling a snowflake.
Use Cases – Snowflake schemas are used in scenarios requiring detailed data models and efficient storage. They are beneficial when dealing with large datasets where data redundancy needs to be minimised.
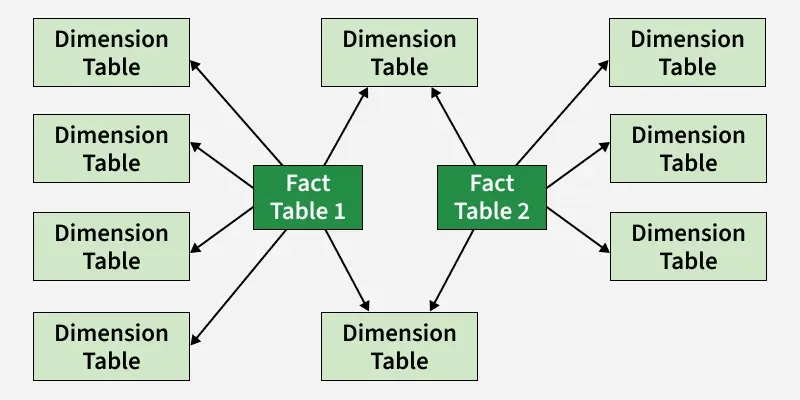
3. Galaxies Schema (Fact Constellation Schema)
Definition – The galaxies schema, also known as the fact constellation schema, involves multiple fact tables that share dimension tables, creating a complex, interconnected data model.
Structure – This schema consists of multiple fact tables linked to shared dimension tables, enabling the analysis of different business processes within a single model.
Use Cases – Galaxies schemas are suitable for large‑scale enterprise environments where multiple related business processes need to be analysed. They support complex queries and detailed reporting across various domains.
How Schemas Impact Power BI
Impact on Performance
- Faster Queries (Star Schema) – A star schema with a central fact table and direct, denormalised dimensions minimises the number of joins the engine must process.
- Slower Queries (Snowflake Schema) – Normalising dimensions into multiple related tables requires more joins, which can slow down report responsiveness, especially with large datasets.
- Efficient Compression – The VertiPaq engine thrives on star schemas, creating smaller in‑memory models that improve visual and calculation speed.
Impact on DAX and Usability
- Simpler DAX (Star Schema) – A clean star schema reduces the need for complex, nested DAX calculations because relationships are direct and easy to follow.
- Filter Propagation – In a star schema, filters move directly from dimension tables to the fact table, ensuring consistent and predictable results.
- Reduced Complexity – A star schema is easier for users to understand and navigate, making self‑service analytics more intuitive.
Impact on Data Integrity and Storage
- Data Accuracy (Star Schema) – While denormalised (some redundancy), star schemas are generally better at preventing ambiguous, bidirectional, or many‑to‑many relationships, thus reducing the risk of double‑counting.
- Storage Efficiency (Snowflake Schema) – Snowflake schemas reduce redundancy, which can save space. However, this is rarely necessary in modern Power BI environments where speed is prioritised over storage costs.
What Is Data Modelling?
Data modelling is the process of creating a visual representation of how data is arranged and related in a database or system.
A data modeller develops a detailed plan for how data will be stored and arranged in a database, much like an architect creates the blueprint of a building.
Why is Data … (the original content ends here)
Is Modelling Important?
Data modelling is important because it turns raw data into a clear, reliable structure that supports accurate analysis, efficient systems, and good decision‑making.
1. Clarity & Structure
Data modelling defines what data exists, how it’s related, and what it means. Without it, data is just a messy pile of tables and columns.
2. Better Decision‑Making
A good model ensures data is consistent, accurate, and complete, so reports and dashboards actually reflect reality—not misleading numbers.
3. Performance & Efficiency
Proper models (e.g., star or snowflake schemas) make queries faster and systems more scalable—critical in analytics, BI, and big‑data environments.
4. Data Integrity & Quality
Constraints, relationships, and rules in a model prevent duplication, inconsistency, and errors (garbage in = garbage out).
5. Easier Maintenance & Scalability
When business needs change, a well‑designed model can be extended without breaking everything else.
6. Common Language Between Teams
Data models act as a bridge between business users, analysts, and engineers, reducing misunderstandings.
7. Foundation for Analytics & AI
Machine learning, reporting, forecasting—none of these work well without a solid underlying data model.
Conclusion
Understanding different schemas in Power BI is crucial for designing efficient data models. Each schema has unique advantages:
| Schema | When to Use | Key Benefits |
|---|---|---|
| Star | Straightforward reporting and querying | Simplicity, ease of use, fast query performance |
| Snowflake | Detailed, highly normalized structures | Reduced redundancy, optimized storage |
| Galaxy (or Fact Constellation) | Complex, large‑scale models with multiple fact tables sharing dimensions | Flexibility for diverse analytical needs |
Choosing the right schema improves query performance, data storage efficiency, and data‑refresh operations. By mastering these schemas, you can create robust and scalable data models that enable your organization to make data‑driven decisions effectively.