Jumia Product Performance Dashboard: Analyzing Pricing, Discounts, and Customer Reviews.
Published: (February 7, 2026 at 06:33 PM EST)
1 min read
Source: Dev.to
Source: Dev.to
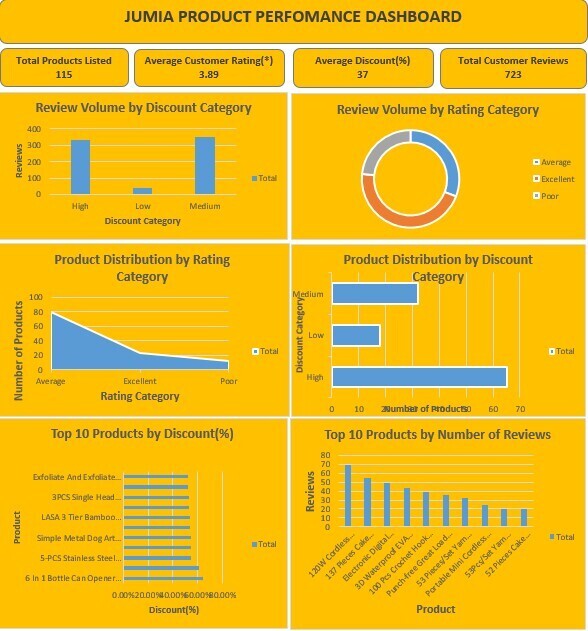
Dataset Overview
The dataset contains 115 rows and six columns. Customer ratings are on a scale of 0 to 5. After performing data cleaning and analysis, a dashboard was created to visualize the insights.
Rating Category
- Poor – ratings below 3
- Average – ratings from 3 up to 4.4
- Excellent – ratings of 4.5 and above
Discount Category
- Low – discounts below 20%
- Medium – discounts between 20% and 40%
- High – discounts above 40%