How I Found 1,370 Fraudsters Hiding in Our Data (And Saved My Company $51,000)
Source: Dev.to – How I found 1,370 fraudsters hiding in our data and saved my company $51,000
The First Clue: When Numbers Tell a Story
Opening the data felt like looking at two different worlds.
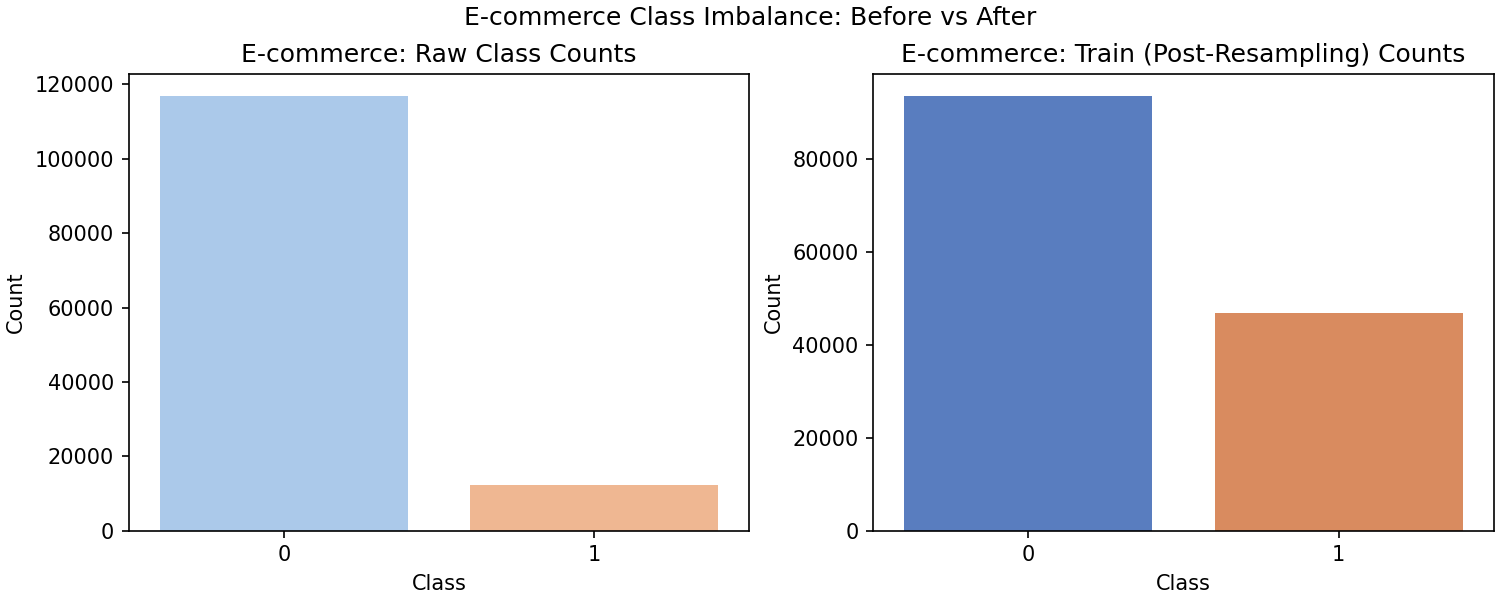
- Credit‑card transactions: fraud in only 0.5 % of cases – tiny red dots in a sea of green.
- E‑commerce platform: nearly 1 in 3 transactions were fraudulent.
I remember thinking,
“How are we even still in business?”
That’s when I built my first visualization—side‑by‑side bars showing the stark difference. Seeing it visually made the problem real; it wasn’t just numbers anymore, it was a pattern screaming for attention.
The Breakthrough: The 1‑Hour Rule
It started as a hunch: “What if fraudsters work fast?”
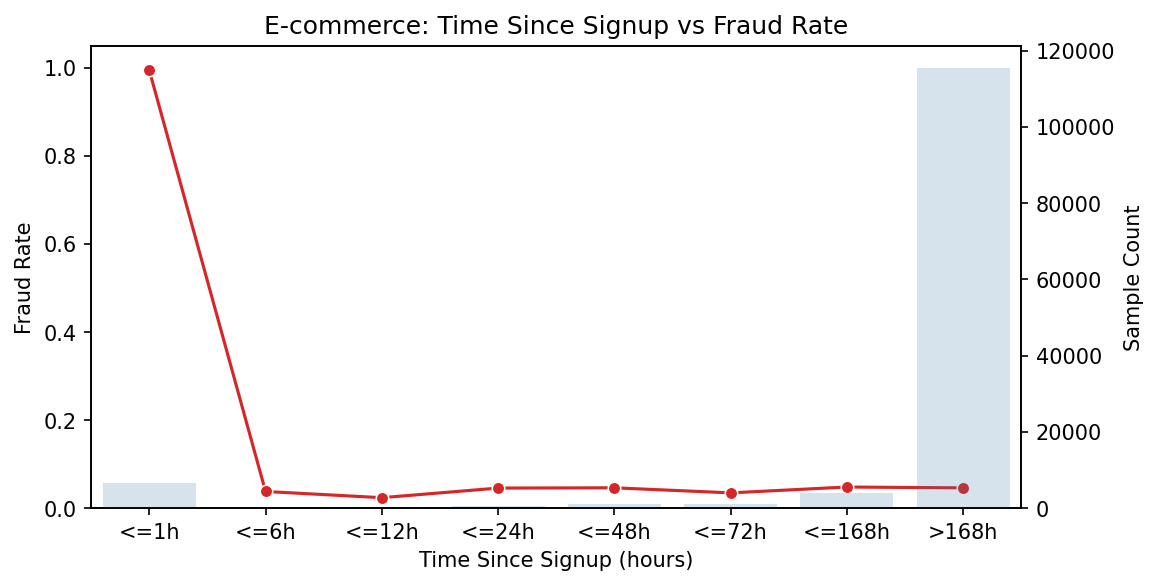
I created a simple calculation: hours between account creation and first purchase. When I plotted it, my coffee went cold.
There it was—a massive spike at the beginning. Transactions within the first hour had a 99.5 % fraud rate—6 685 cases of “sign up, steal, disappear.”
The visualization looked like a mountain with the peak shoved all the way to the left. It was so clear, so obvious. How had we missed this?
Building the Fraud Catchers
| Channel | Model | Reason | Results |
|---|---|---|---|
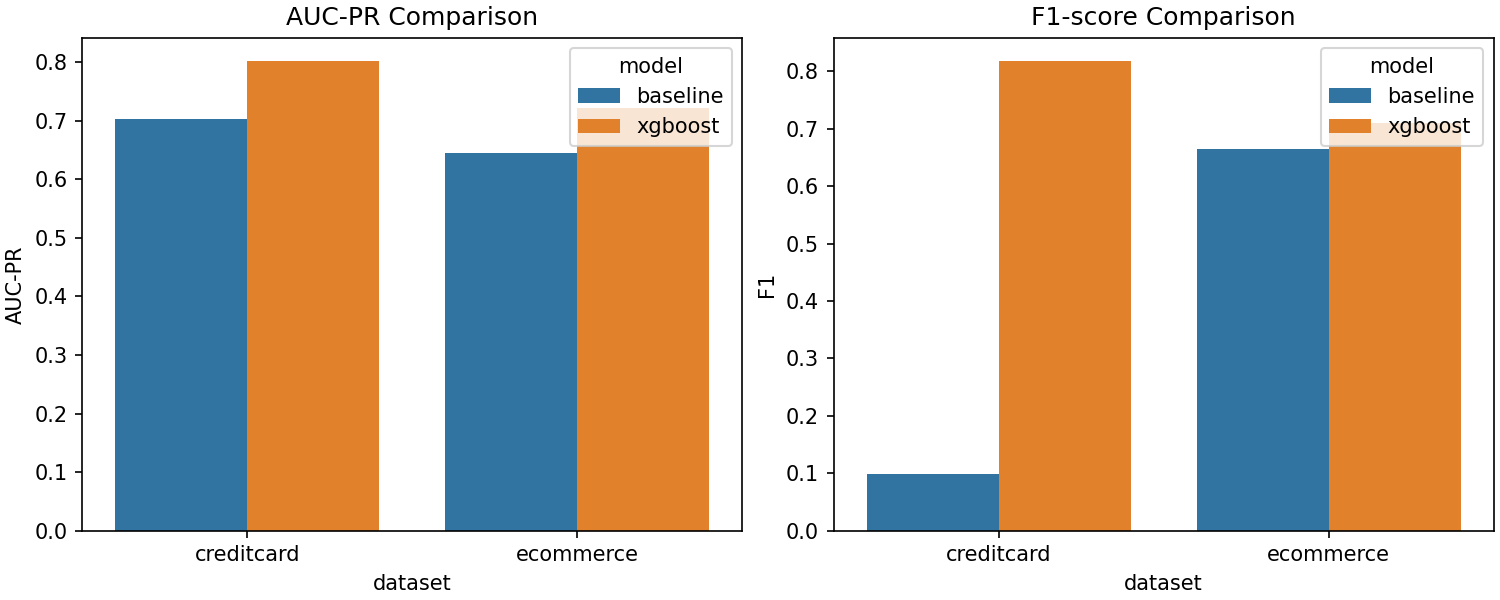
| Credit‑card | XGBoost | Powerful ensemble that learns complex interactions | 76 fraudsters caught, 15 false alarms |
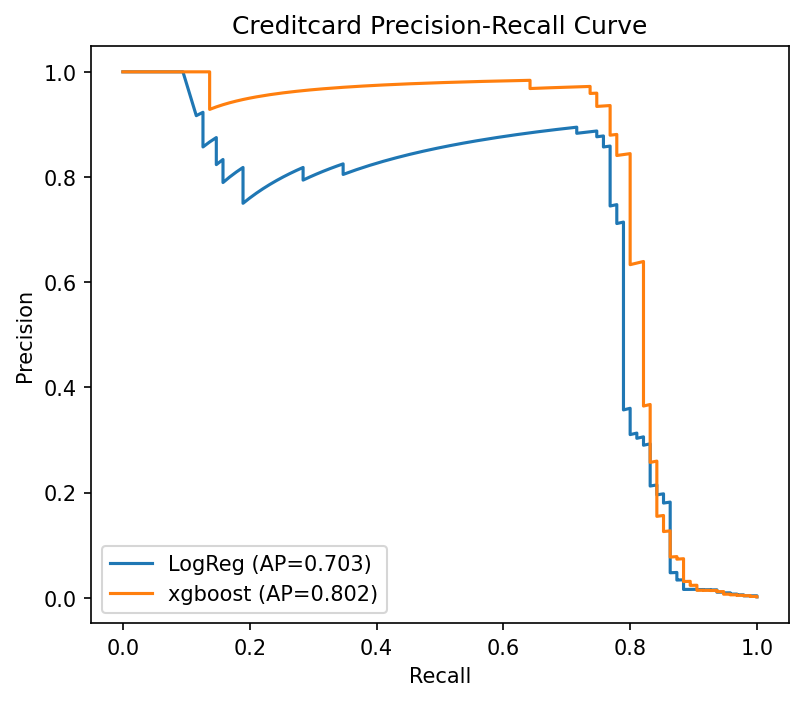
| E‑commerce | Logistic Regression | High interpretability for customer‑facing decisions | 1 370 frauds caught (vs. 1 409 possible) with clear explanations |
My model‑comparison chart tells the story—different problems need different tools.
The Most Fascinating Part: Asking “Why?”
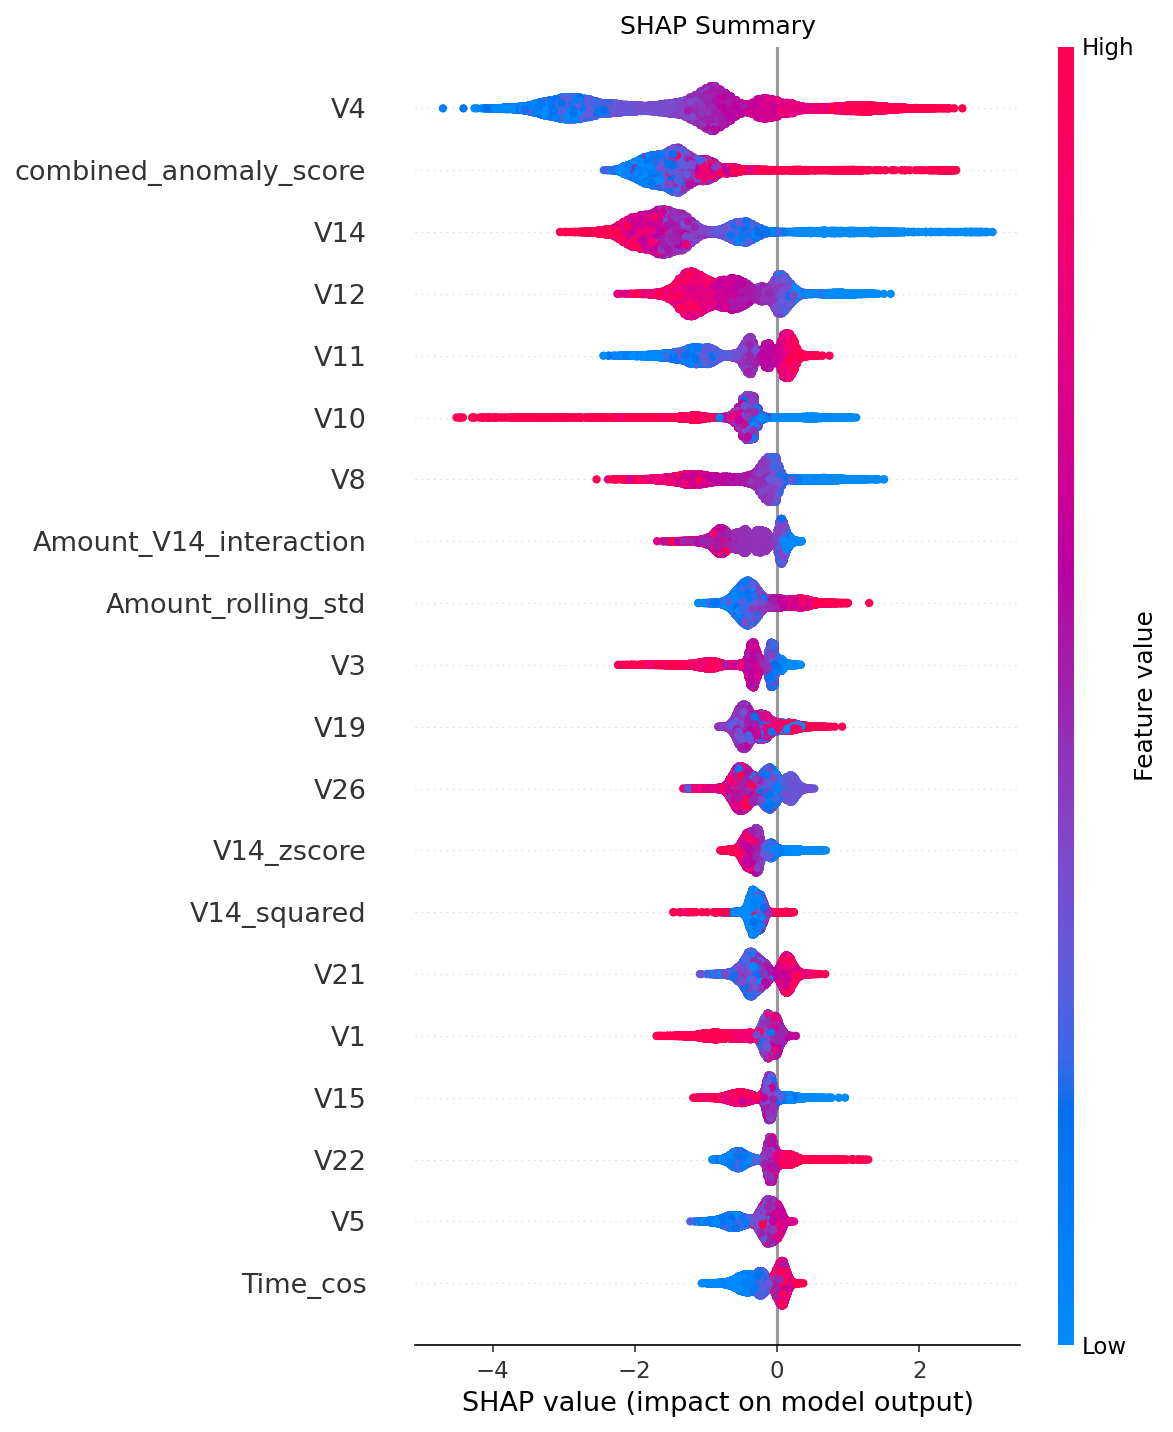
Using SHAP felt like putting on X‑ray glasses. Suddenly I could see what the model was thinking.
- The top predictors weren’t what I expected. An anonymized V4 feature mattered most, followed by our custom anomaly score.
- The model was finding patterns in places I hadn’t even looked.
The real magic was in the individual cases. A SHAP force plot for a caught $257 fraud let me trace exactly why—the timing, a weird V14 value, and the new account. It wasn’t magic; it was math we could explain.
From Insights to Action: Three Changes We’re Making
-
The 1‑Hour Checkpoint
Starting Monday, any purchase within an hour of signup will trigger a gentle extra verification step (e.g., “Hey, confirm this is you?”). Based on our data, this alone could stop thousands of fraudulent attempts. -
Smarter Geography
We found countries with shockingly high fraud rates (looking at you, Turkmenistan at 100 %). Rather than blanket blocks, we’ll add intelligent scrutiny: legitimate customers get through, fraudsters hit roadblocks. -
Dynamic Decisions
Our confusion matrices showed we need different approaches.- Credit‑card channel: prioritize precision — be super sure before flagging.
- E‑commerce channel: prioritize recall — catch more frauds while maintaining explainability.
The Business Impact (Or: How I Justified My Salary)
Let’s talk numbers
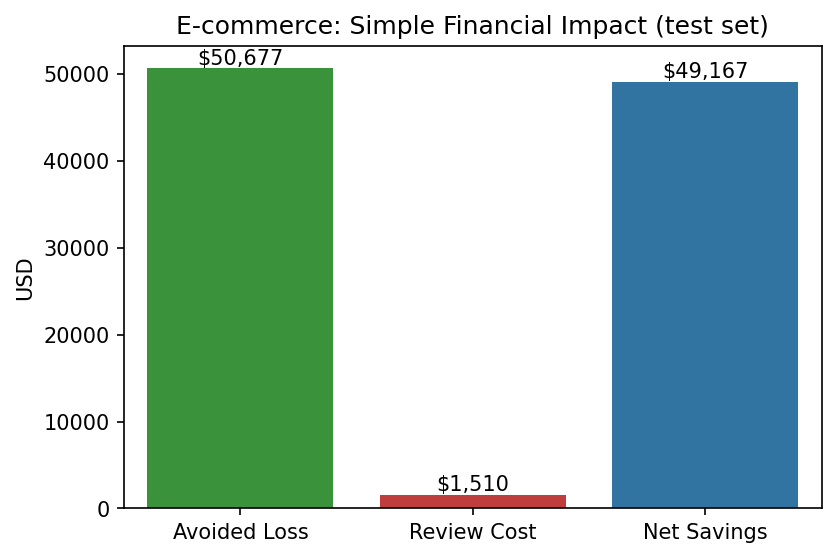
- Test‑data impact: $51,000 saved
- Monthly projection: $200,000+
- Annual potential: Millions
But it’s not just about money—trust matters. We can now tell customers exactly why their transaction was flagged, eliminating the “the system says so” black‑box feeling.
The financial‑impact visualization made my case to management in 10 seconds flat.
What I Wish I Knew Then
- Simple beats complex – The 1‑hour rule required no machine learning to discover.
- Explainability matters – Logistic Regression won for e‑commerce because we could defend it.
- Fraudsters adapt – Today’s patterns become tomorrow’s history.
The Big Realization
The most valuable insight wasn’t in the fancy algorithms. It was in asking a simple question:
“What happens right after someone signs up?”
Sometimes the most powerful data science is asking obvious questions and having the courage to believe the answers, even when they seem too simple to be true.
Want to see how we did it?
The code, the struggles, and the celebrations are all here:
Question for you: What’s the most surprising pattern you’ve found in your data?
Coffee consumption during this project: 47 cups ☕
Regrets: Zero