调试 Node.js 内存不足崩溃:实用的逐步案例
Source: Dev.to
我们是如何追踪到一个微妙的内存泄漏,它不断导致我们的生产服务器宕机——以及我们是如何彻底修复它的。
让周一早晨崩溃的 OOM
一切看起来正常——直到警报开始触发。我们的 Node.js API 实例一个接一个地崩溃,出现了熟悉但令人恐惧的信息:
FATAL ERROR: Reached heap limit Allocation failed - JavaScript heap out of memory这个模式令人沮丧地一致:
- 服务器可以正常运行数小时
- 流量增加
- 内存稳步上升
- 然后 💥 — 崩溃
如果你曾在生产环境中使用 Node.js,你已经知道这是什么味道:内存泄漏。
在本文中,我将详细说明我们是如何诊断该问题的,哪些信号最为关键,以及在高负载下稳定内存的简单解决方案。
阅读 GC 的茶叶
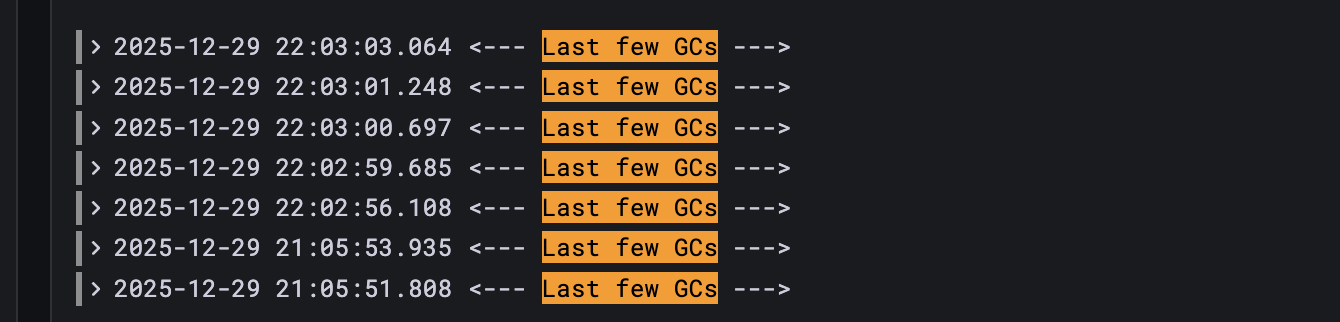
在动手写代码之前,我们仔细查看了 V8 的垃圾回收器输出:
Mark-Compact (reduce) 646.7 (648.5) -> 646.6 (648.2) MB乍一看,这似乎无害。但关键的洞察是:
GC 几乎没有释放任何内存。
从约 646.7 MB 降到约 646.6 MB —— 实际上为零。
这告诉了我们什么
- GC 正在频繁且耗时地运行。
- 对象仍然被强引用。
- 内存 不 符合回收条件。
简而言之:这不是“GC 变慢”——而是内存泄漏或过度分配。
准备战场
1. 确认堆限制
首先,确认 Node.js 实际允许使用的内存量:
const v8 = require('v8');

console.log(
  'Heap limit:',
  Math.round(v8.getHeapStatistics().heap_size_limit / 1024 / 1024),
  'MB'
);
这消除了猜测——在容器或云运行时尤其重要。
2. 开启 GC 跟踪
实时观察 GC 行为:
node --trace-gc server.js您会看到:
- Scavenge → 小型 GC(年轻对象)
- Mark‑Sweep / Mark‑Compact → 大型 GC(老年代)
频繁的大型 GC 且清理不彻底是一个巨大的警示信号。
3. 缩小堆(有意为之)
与其等数小时才出现生产崩溃,不如在本地强行触发问题:
node --max-old-space-size=128 server.js更小的堆会让内存问题快速显现——通常在几分钟内。
4. 通过负载复现
编写一个简单的并发负载脚本来模拟真实流量。在负载下,内存会持续上升且永不下降。
至此,您已经得到可靠的复现。是时候去追踪泄漏了。
Source: …
内存测试的负载测试脚本
为了在本地可靠地复现内存泄漏问题(而不是等待真实流量),我们使用一个极简的 负载测试模板。该脚本:
- 没有外部依赖——仅使用内置的
http模块 - 允许你在命令行中设置 并发数
- 完全消费每个响应,以便释放套接字并保证内存使用的准确性
- 旨在用于 GC / 堆行为调查,而非性能基准测试
使用方法
node load-test.js [concurrent] [endpoint]

# 示例 – 对 “data” 接口发起 100 个并行请求
node load-test.js 100 data
负载测试模板

/**
 * Load Test Script for Memory Testing
 * Usage: node load-test.js [concurrent] [endpoint]
 * Example: node load-test.js 100 data
 */

const http = require('http');

const CONFIG = {
  hostname: 'localhost',
  port: 3000,
  endpoints: {
    data: {
      path: '/api/data',
      method: 'POST',
      headers: {
        'Content-Type': 'application/json',
      },
      body: JSON.stringify({
        items: ['sample_item'],
        userContext: {
          userId: 'test-user',
          sessionId: 'test-session',
        },
      }),
    },
    // Add more endpoint definitions here if needed
  },
};

const CONCURRENT = parseInt(process.argv[2], 10) || 50;
const ENDPOINT = process.argv[3] || 'data';

const endpointConfig = CONFIG.endpoints[ENDPOINT];
if (!endpointConfig) {
  console.error(
    `Unknown endpoint: ${ENDPOINT}. Available: ${Object.keys(
      CONFIG.endpoints,
    ).join(', ')}`,
  );
  process.exit(1);
}

/**
 * Sends a single HTTP request and resolves with a result object.
 * @param {number} requestId – Identifier for logging/debugging.
 * @returns {Promise<Object>}
 */
const makeRequest = (requestId) => {
  return new Promise((resolve) => {
    const startTime = Date.now();

    const options = {
      hostname: CONFIG.hostname,
      port: CONFIG.port,
      path: endpointConfig.path,
      method: endpointConfig.method,
      headers: endpointConfig.headers,
    };

    const req = http.request(options, (res) => {
      // Consume the response body so the socket can be reused.
      res.resume();

      res.on('end', () => {
        const success = res.statusCode >= 200 && res.statusCode < 300;
        resolve({
          requestId,
          success,
          status: res.statusCode,
          duration: Date.now() - startTime,
        });
      });
    });

    // Handle network / request errors.
    req.on('error', (err) => {
      resolve({
        requestId,
        success: false,
        duration: Date.now() - startTime,
        error: err.message,
      });
    });

    // Send the request body (if any) and finish the request.
    if (endpointConfig.body) {
      req.write(endpointConfig.body);
    }
    req.end();
  });
};

/**
 * Fires `CONCURRENT` requests in parallel and prints a short summary.
 */
const runLoadTest = async () => {
  const promises = [];
  for (let i = 0; i < CONCURRENT; i++) {
    promises.push(makeRequest(i));
  }

  const results = await Promise.all(promises);
  const successes = results.filter((r) => r.success).length;
  const failures = results.length - successes;

  console.log(`✅ Completed ${results.length} requests`);
  console.log(`   • succeeded: ${successes}`);
  console.log(`   • failed   : ${failures}`);
};

runLoadTest().catch((err) => {
  console.error('Unexpected error:', err);
  process.exit(1);
});
有了这个脚本,你可以快速启动受控负载,附加任意需要的监控手段(例如 node --inspect、clinic heapprofile、自定义的 process.memoryUsage() 日志),从而定位出哪些代码路径保留了不该保留的引用。In the origina
如果罪魁祸首是一个过期的缓存对象;一旦将其清除,垃圾回收器就会如预期般回收内存,生产环境的崩溃也随之消失。
内存负载测试
// Timeout handling (example)
setTimeout(() => {
  req.destroy();
  resolve({
    requestId,
    success: false,
    duration: Date.now() - startTime,
    error: 'Timeout',
  });
}, 30000);

if (endpointConfig.body) {
  req.write(endpointConfig.body);
}

req.end();
const runLoadTest = async () => {
console.log('='.repeat(60));
console.log('MEMORY LOAD TEST');
console.log('='.repeat(60));
console.log(`Endpoint: ${endpointConfig.method} ${endpointConfig.path}`);
console.log(`Concurrent Requests: ${CONCURRENT}`);
console.log(`Target: ${CONFIG.hostname}:${CONFIG.port}`);
console.log('='.repeat(60));
console.log('\nStarting load test...\n');
const startTime = Date.now();
const promises = Array.from({ length: CONCURRENT }, (_, i) =>
makeRequest(i + 1)
);
const results = await Promise.all(promises);
const totalTime = Date.now() - startTime;
const successful = results.filter((r) => r.success);
const failed = results.filter((r) => !r.success);
const durations = successful.map((r) => r.duration);
const avgDuration = durations.length
? Math.round(durations.reduce((a, b) => a + b, 0) / durations.length)
: 0;
console.log('='.repeat(60));
console.log('RESULTS');
console.log('='.repeat(60));
console.log(`Total Requests: ${CONCURRENT}`);
console.log(`Successful: ${successful.length}`);
console.log(`Failed: ${failed.length}`);
console.log(`Total Time: ${totalTime} ms`);
console.log(`Avg Response Time: ${avgDuration} ms`);
console.log(`Min Response Time: ${Math.min(...durations)} ms`);
console.log(`Max Response Time: ${Math.max(...durations)} ms`);
console.log(
`Requests/sec: ${Math.round(CONCURRENT / (totalTime / 1000))}`
);
console.log('='.repeat(60));
if (failed.length) {
console.log('\nFailed requests:');
failed.slice(0, 5).forEach((r) => {
console.log(` Request #${r.requestId}: ${r.error}`);
});
}
console.log('\n>>> Check server logs for [MEM] entries <<<');
};
const logMemory = (label) => {
const { heapUsed } = process.memoryUsage();
console.log(`[MEM] ${label}: ${Math.round(heapUsed / 1024 / 1024)} MB`);
};观察到的日志输出
在负载下,日志清晰地讲述了一个故事:
processData START: 85 MB
processData START: 92 MB
processData START: 99 MB
processData START: 107 MB
内存持续攀升——一次又一次的请求。最终,所有问题都指向了一个看似无害的辅助函数。
真正的罪魁祸首
const getItemAssets = (itemType) => {
  const assetConfig = {
    item_a: { thumbnail: '...', full: '...' },
    item_b: { thumbnail: '...', full: '...' },
    // many more entries
  };

  return assetConfig[itemType] || { thumbnail: '', full: '' };
};
为什么这很灾难性
- 配置对象在每次调用时都会重新创建。
每次调用都会构建一个全新的assetConfig对象,导致不必要的分配。 - 函数在每个请求中会被多次运行。
重复执行相同的逻辑会放大分配成本。 - 在并发情况下,每秒会创建成千上万的对象。
即使垃圾回收器最终可以清理它们,分配速度也超过了回收速度,导致对象进入老年代,最终耗尽堆内存。
修复:一次小改动,巨大影响
// Asset configuration – created once and frozen
const ASSET_CONFIG = Object.freeze({
  item_a: { thumbnail: '...', full: '...' },
  item_b: { thumbnail: '...', full: '...' },
  // …other items
});

// Fallback for unknown item types
const DEFAULT_ASSET = Object.freeze({ thumbnail: '', full: '' });

/**
 * Returns the assets for the given item type.
 * If the type is not found, the default (empty) asset is returned.
 *
 * @param {string} itemType – key from ASSET_CONFIG
 * @returns {{thumbnail:string, full:string}}
 */
const getItemAssets = (itemType) => ASSET_CONFIG[itemType] || DEFAULT_ASSET;
有什么变化?
- 对象只创建一次,而不是在每次请求时创建。
- 热路径中没有新的分配。
- 垃圾回收压力显著降低。
证明修复有效
我们重新运行了完全相同的测试。
之前
- 堆内存不断攀升。
- GC 几乎没有释放任何内存。
- 进程在约 128 MB 时崩溃。
之后
- 堆使用量在一个狭窄范围内波动。
- 小型 GC 有效地清理了内存。
- 没有崩溃——即使在持续负载下也是如此。
Final Thought
大多数 Node.js OOM 崩溃并不是由 “巨大的数据” 或 “糟糕的 GC” 引起的。它们是由 错误位置的 小且重复的分配 引起的。
一旦你学会阅读 GC 日志并控制分配速率,内存错误就不再神秘——而是可以修复的。