Node.js Out-of-Memory 충돌 디버깅: 실용적인 단계별 스토리
Source: Dev.to
우리의 프로덕션 서버를 계속 다운시켰던 미묘한 메모리 누수를 어떻게 추적했는지, 그리고 어떻게 영구적으로 해결했는지에 대한 이야기.
월요일 아침을 망친 OOM
모든 것이 정상처럼 보였지만 알림이 울리기 시작했습니다. 하나씩, 우리 Node.js API 인스턴스들이 익숙하지만 두려운 메시지와 함께 충돌했습니다:
FATAL ERROR: Reached heap limit Allocation failed - JavaScript heap out of memory패턴은 짜증날 정도로 일관되었습니다:
- 서버는 몇 시간 동안 정상적으로 동작했습니다
- 트래픽이 증가했습니다
- 메모리가 꾸준히 상승했습니다
- 그때 💥 — 충돌이 발생했습니다
프로덕션 환경에서 Node.js를 다뤄본 적이 있다면, 이것이 무엇을 의미하는지 이미 알고 있을 겁니다: 메모리 누수.
이 글에서는 우리가 문제를 어떻게 진단했는지, 가장 중요한 신호는 무엇이었는지, 그리고 높은 부하 하에서 메모리를 안정화시킨 간단한 해결책을 단계별로 설명하겠습니다.
Source:
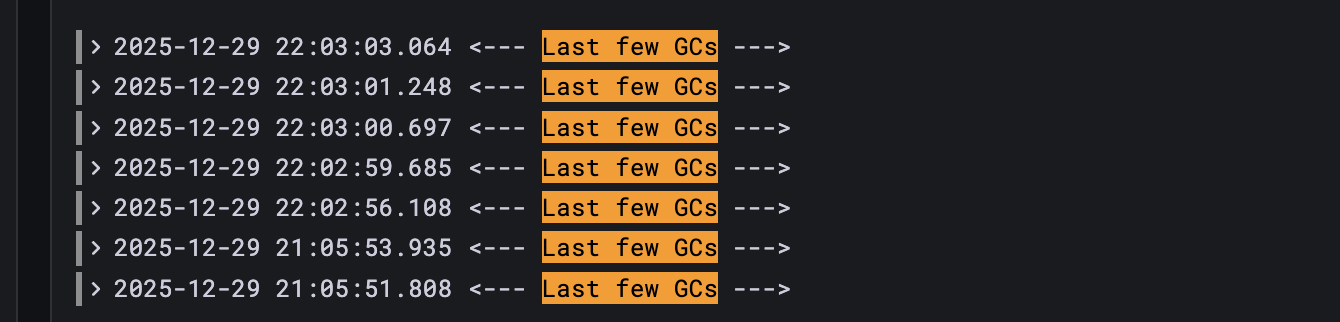
GC 차트 읽기
코드를 건드리기 전에 V8의 가비지 컬렉터 출력 결과를 자세히 살펴보았습니다:
Mark-Compact (reduce) 646.7 (648.5) -> 646.6 (648.2) MB언뜻 보기엔 별다른 문제가 없어 보입니다. 하지만 핵심 통찰은 다음과 같습니다:
GC가 거의 아무것도 해제하지 않았습니다.
약 646.7 MB에서 646.6 MB로 – 실질적으로 0에 가깝습니다.
이것이 의미하는 바
- GC가 자주, 그리고 비용이 많이 들면서 실행되고 있습니다.
- 객체들이 여전히 강하게 참조되고 있습니다.
- 메모리가 수집 대상이 될 수 없습니다.
요컨대: “GC가 느리다”는 것이 아니라, 메모리 누수 혹은 과다 할당이 발생하고 있는 상황입니다.
전장을 준비하기
1. 힙 제한 확인
먼저, Node.js가 실제로 사용할 수 있는 메모리 양을 확인합니다:
const v8 = require('v8');

console.log(
  'Heap limit:',
  Math.round(v8.getHeapStatistics().heap_size_limit / 1024 / 1024),
  'MB'
);
이렇게 하면 추측이 사라집니다—특히 컨테이너나 클라우드 런타임에서 중요합니다.
2. GC 추적 활성화
실시간으로 GC 동작을 관찰합니다:
node --trace-gc server.js다음과 같은 결과가 나타납니다:
- Scavenge → 마이너 GC (젊은 객체)
- Mark‑Sweep / Mark‑Compact → 메이저 GC (오래된 세대)
정리되지 않은 상태의 빈번한 메이저 GC는 큰 위험 신호입니다.
3. 힙 축소 (의도적으로)
프로덕션에서 수시간을 기다리는 대신, 로컬에서 문제를 강제로 발생시킵니다:
node --max-old-space-size=128 server.js작은 힙은 메모리 문제가 빠르게 나타나게 합니다—보통 몇 분 안에.
4. 부하를 걸어 재현하기
실제 트래픽을 모방하는 간단한 동시 부하 스크립트를 작성합니다. 부하가 걸리면 메모리가 지속적으로 증가하고 다시 감소하지 않습니다.
이 시점에서 신뢰할 수 있는 재현이 확보되었습니다. 이제 메모리 누수를 찾아볼 차례입니다.
메모리 테스트용 로드 테스트 스크립트
실제 트래픽을 기다리는 대신 로컬에서 메모리 누수 문제를 안정적으로 재현하기 위해 로드‑테스트 템플릿을 사용합니다. 이 스크립트는:
- 외부 의존성이 없습니다 – 내장
http모듈만 사용 - 명령줄에서 동시성(concurrency) 을 설정할 수 있음
- 각 응답을 완전히 소비하여 소켓이 해제되고 메모리 사용량이 정확하게 측정됨
- GC / 힙 동작 조사용이며 성능 벤치마킹용은 아닙니다
사용법
node load-test.js [concurrent] [endpoint]

# 예시 – “data” 엔드포인트에 100개의 병렬 요청
node load-test.js 100 data
로드‑테스트 템플릿

/**
 * Load Test Script for Memory Testing
 * Usage: node load-test.js [concurrent] [endpoint]
 * Example: node load-test.js 100 data
 */

const http = require('http');

const CONFIG = {
  hostname: 'localhost',
  port: 3000,
  endpoints: {
    data: {
      path: '/api/data',
      method: 'POST',
      headers: {
        'Content-Type': 'application/json',
      },
      body: JSON.stringify({
        items: ['sample_item'],
        userContext: {
          userId: 'test-user',
          sessionId: 'test-session',
        },
      }),
    },
    // Add more endpoint definitions here if needed
  },
};

const CONCURRENT = parseInt(process.argv[2], 10) || 50;
const ENDPOINT = process.argv[3] || 'data';

const endpointConfig = CONFIG.endpoints[ENDPOINT];
if (!endpointConfig) {
  console.error(
    `Unknown endpoint: ${ENDPOINT}. Available: ${Object.keys(
      CONFIG.endpoints,
    ).join(', ')}`,
  );
  process.exit(1);
}

/**
 * Sends a single HTTP request and resolves with a result object.
 * @param {number} requestId – Identifier for logging/debugging.
 * @returns {Promise<Object>}
 */
const makeRequest = (requestId) => {
  return new Promise((resolve) => {
    const startTime = Date.now();

    const options = {
      hostname: CONFIG.hostname,
      port: CONFIG.port,
      path: endpointConfig.path,
      method: endpointConfig.method,
      headers: endpointConfig.headers,
    };

    const req = http.request(options, (res) => {
      // Consume the response body so the socket can be reused.
      res.resume();

      res.on('end', () => {
        const success = res.statusCode >= 200 && res.statusCode < 300;
        resolve({
          requestId,
          success,
          status: res.statusCode,
          duration: Date.now() - startTime,
        });
      });
    });

    // Handle network / request errors.
    req.on('error', (err) => {
      resolve({
        requestId,
        success: false,
        duration: Date.now() - startTime,
        error: err.message,
      });
    });

    // Send the request body (if any) and finish the request.
    if (endpointConfig.body) {
      req.write(endpointConfig.body);
    }
    req.end();
  });
};

/**
 * Fires `CONCURRENT` requests in parallel and prints a short summary.
 */
const runLoadTest = async () => {
  const promises = [];
  for (let i = 0; i < CONCURRENT; i++) {
    promises.push(makeRequest(i));
  }

  const results = await Promise.all(promises);
  const successes = results.filter((r) => r.success).length;
  const failures = results.length - successes;

  console.log(`✅ Completed ${results.length} requests`);
  console.log(`   • succeeded: ${successes}`);
  console.log(`   • failed   : ${failures}`);
};

runLoadTest().catch((err) => {
  console.error('Unexpected error:', err);
  process.exit(1);
});
이 스크립트를 사용하면 제어된 부하를 빠르게 가동하고, node --inspect, clinic heapprofile, 사용자 정의 process.memoryUsage() 로그 등 필요한 어떤 계측도 연결할 수 있어, 코드가 필요 이상으로 참조를 유지하고 있던 경로를 정확히 찾아낼 수 있습니다. 원본에서는 …
이 경우 원인은 오래된 캐시된 객체였으며; 이를 삭제하자 가비지 컬렉터가 예상대로 메모리를 회수했고, 프로덕션 크래시가 사라졌다.
메모리 로드 테스트
// Timeout handling (example)
setTimeout(() => {
  req.destroy();
  resolve({
    requestId,
    success: false,
    duration: Date.now() - startTime,
    error: 'Timeout',
  });
}, 30000);

if (endpointConfig.body) {
  req.write(endpointConfig.body);
}

req.end();
const runLoadTest = async () => {
console.log('='.repeat(60));
console.log('MEMORY LOAD TEST');
console.log('='.repeat(60));
console.log(`Endpoint: ${endpointConfig.method} ${endpointConfig.path}`);
console.log(`Concurrent Requests: ${CONCURRENT}`);
console.log(`Target: ${CONFIG.hostname}:${CONFIG.port}`);
console.log('='.repeat(60));
console.log('\nStarting load test...\n');
const startTime = Date.now();
const promises = Array.from({ length: CONCURRENT }, (_, i) =>
makeRequest(i + 1)
);
const results = await Promise.all(promises);
const totalTime = Date.now() - startTime;
const successful = results.filter((r) => r.success);
const failed = results.filter((r) => !r.success);
const durations = successful.map((r) => r.duration);
const avgDuration = durations.length
? Math.round(durations.reduce((a, b) => a + b, 0) / durations.length)
: 0;
console.log('='.repeat(60));
console.log('RESULTS');
console.log('='.repeat(60));
console.log(`Total Requests: ${CONCURRENT}`);
console.log(`Successful: ${successful.length}`);
console.log(`Failed: ${failed.length}`);
console.log(`Total Time: ${totalTime} ms`);
console.log(`Avg Response Time: ${avgDuration} ms`);
console.log(`Min Response Time: ${Math.min(...durations)} ms`);
console.log(`Max Response Time: ${Math.max(...durations)} ms`);
console.log(
`Requests/sec: ${Math.round(CONCURRENT / (totalTime / 1000))}`
);
console.log('='.repeat(60));
if (failed.length) {
console.log('\nFailed requests:');
failed.slice(0, 5).forEach((r) => {
console.log(` Request #${r.requestId}: ${r.error}`);
});
}
console.log('\n>>> Check server logs for [MEM] entries <<<');
};
const logMemory = (label) => {
const { heapUsed } = process.memoryUsage();
console.log(`[MEM] ${label}: ${Math.round(heapUsed / 1024 / 1024)} MB`);
};관찰된 로그 출력
부하가 걸리면 로그가 명확한 이야기를 전했습니다:
processData START: 85 MB
processData START: 92 MB
processData START: 99 MB
processData START: 107 MB
메모리가 계속 증가했습니다—요청이 이어질수록. 결국 모든 경로가 무고해 보이는 하나의 헬퍼 함수로 이어졌습니다.
실제 원인
const getItemAssets = (itemType) => {
  const assetConfig = {
    item_a: { thumbnail: '...', full: '...' },
    item_b: { thumbnail: '...', full: '...' },
    // many more entries
  };

  return assetConfig[itemType] || { thumbnail: '', full: '' };
};
왜 이것이 재앙이었는가
- 구성 객체가 매 호출마다 재생성되었습니다.
각 호출마다 새로운assetConfig객체를 만들기 때문에 불필요한 메모리 할당이 발생합니다. - 함수가 요청당 여러 번 실행되었습니다.
동일한 로직을 반복해서 실행하면 할당 비용이 더욱 증가합니다. - 동시성 상황에서 초당 수만 개의 객체가 생성되었습니다.
가비지 컬렉터가 결국 정리할 수는 있지만, 할당 속도가 회수 속도를 앞서면서 객체가 오래된 세대로 이동하고 결국 힙을 고갈시킵니다.
Source: …
해결책: 작은 움직임 하나, 큰 영향
// Asset configuration – created once and frozen
const ASSET_CONFIG = Object.freeze({
  item_a: { thumbnail: '...', full: '...' },
  item_b: { thumbnail: '...', full: '...' },
  // …other items
});

// Fallback for unknown item types
const DEFAULT_ASSET = Object.freeze({ thumbnail: '', full: '' });

/**
 * Returns the assets for the given item type.
 * If the type is not found, the default (empty) asset is returned.
 *
 * @param {string} itemType – key from ASSET_CONFIG
 * @returns {{thumbnail:string, full:string}}
 */
const getItemAssets = (itemType) => ASSET_CONFIG[itemType] || DEFAULT_ASSET;
무엇이 바뀌었나요?
- 객체가 한 번만 생성됩니다. 매 요청마다 생성되지 않죠.
- 핫 경로에서 새로운 할당이 전혀 없습니다.
- GC(가비지 컬렉션) 압력이 크게 감소했습니다.
Fix가 작동했음을 증명
우리는 정확히 같은 테스트를 다시 실행했습니다.
이전
- 힙이 끊임없이 증가했습니다.
- GC가 거의 아무것도 해제하지 못했습니다.
- 프로세스가 약 128 MB에서 충돌했습니다.
이후
- 힙 사용량이 좁은 범위 내에서 진동했습니다.
- Minor GC가 메모리를 효율적으로 정리했습니다.
- 지속적인 부하에서도 충돌이 발생하지 않았습니다.
Final Thought
대부분의 Node.js OOM 충돌은 “거대한 데이터”나 “잘못된 GC” 때문에 발생하는 것이 아닙니다.
그것은 잘못된 위치에서 작은, 반복적인 할당 때문에 발생합니다.
GC 로그를 읽고 할당 속도를 제어하는 방법을 배우면, 메모리 버그가 신비롭게 보이지 않게 되고—수정 가능해집니다.