Why 90% of Trading Strategies Fail: A Deep Dive into Analytical Guardrails
Source: Dev.to
When you build a trading bot, the backtest is your honeymoon phase
The equity curve goes up and to the right, the Sharpe ratio looks elite, and you start calculating your retirement.
📖 Missed Part 1?
Before diving into the technical blocks, catch up on the philosophy behind Kiploks:
Part 1: We Built an Optimization Engine — and Realized Optimization Was the Wrong Problem
Then you go live, and reality hits like a freight train.
In my previous post, I argued that optimization is often the wrong problem to solve. Today, I want to show you exactly how we use Kiploks to dismantle an over‑optimized strategy. We aren’t looking for “winning” numbers; we are looking for reasons to reject the strategy before it costs us real capital.
Here are the first four analytical guardrails I’ve built to separate “paper tigers” from tradable edges.
1. The Benchmark Comparison: Alpha vs. Noise
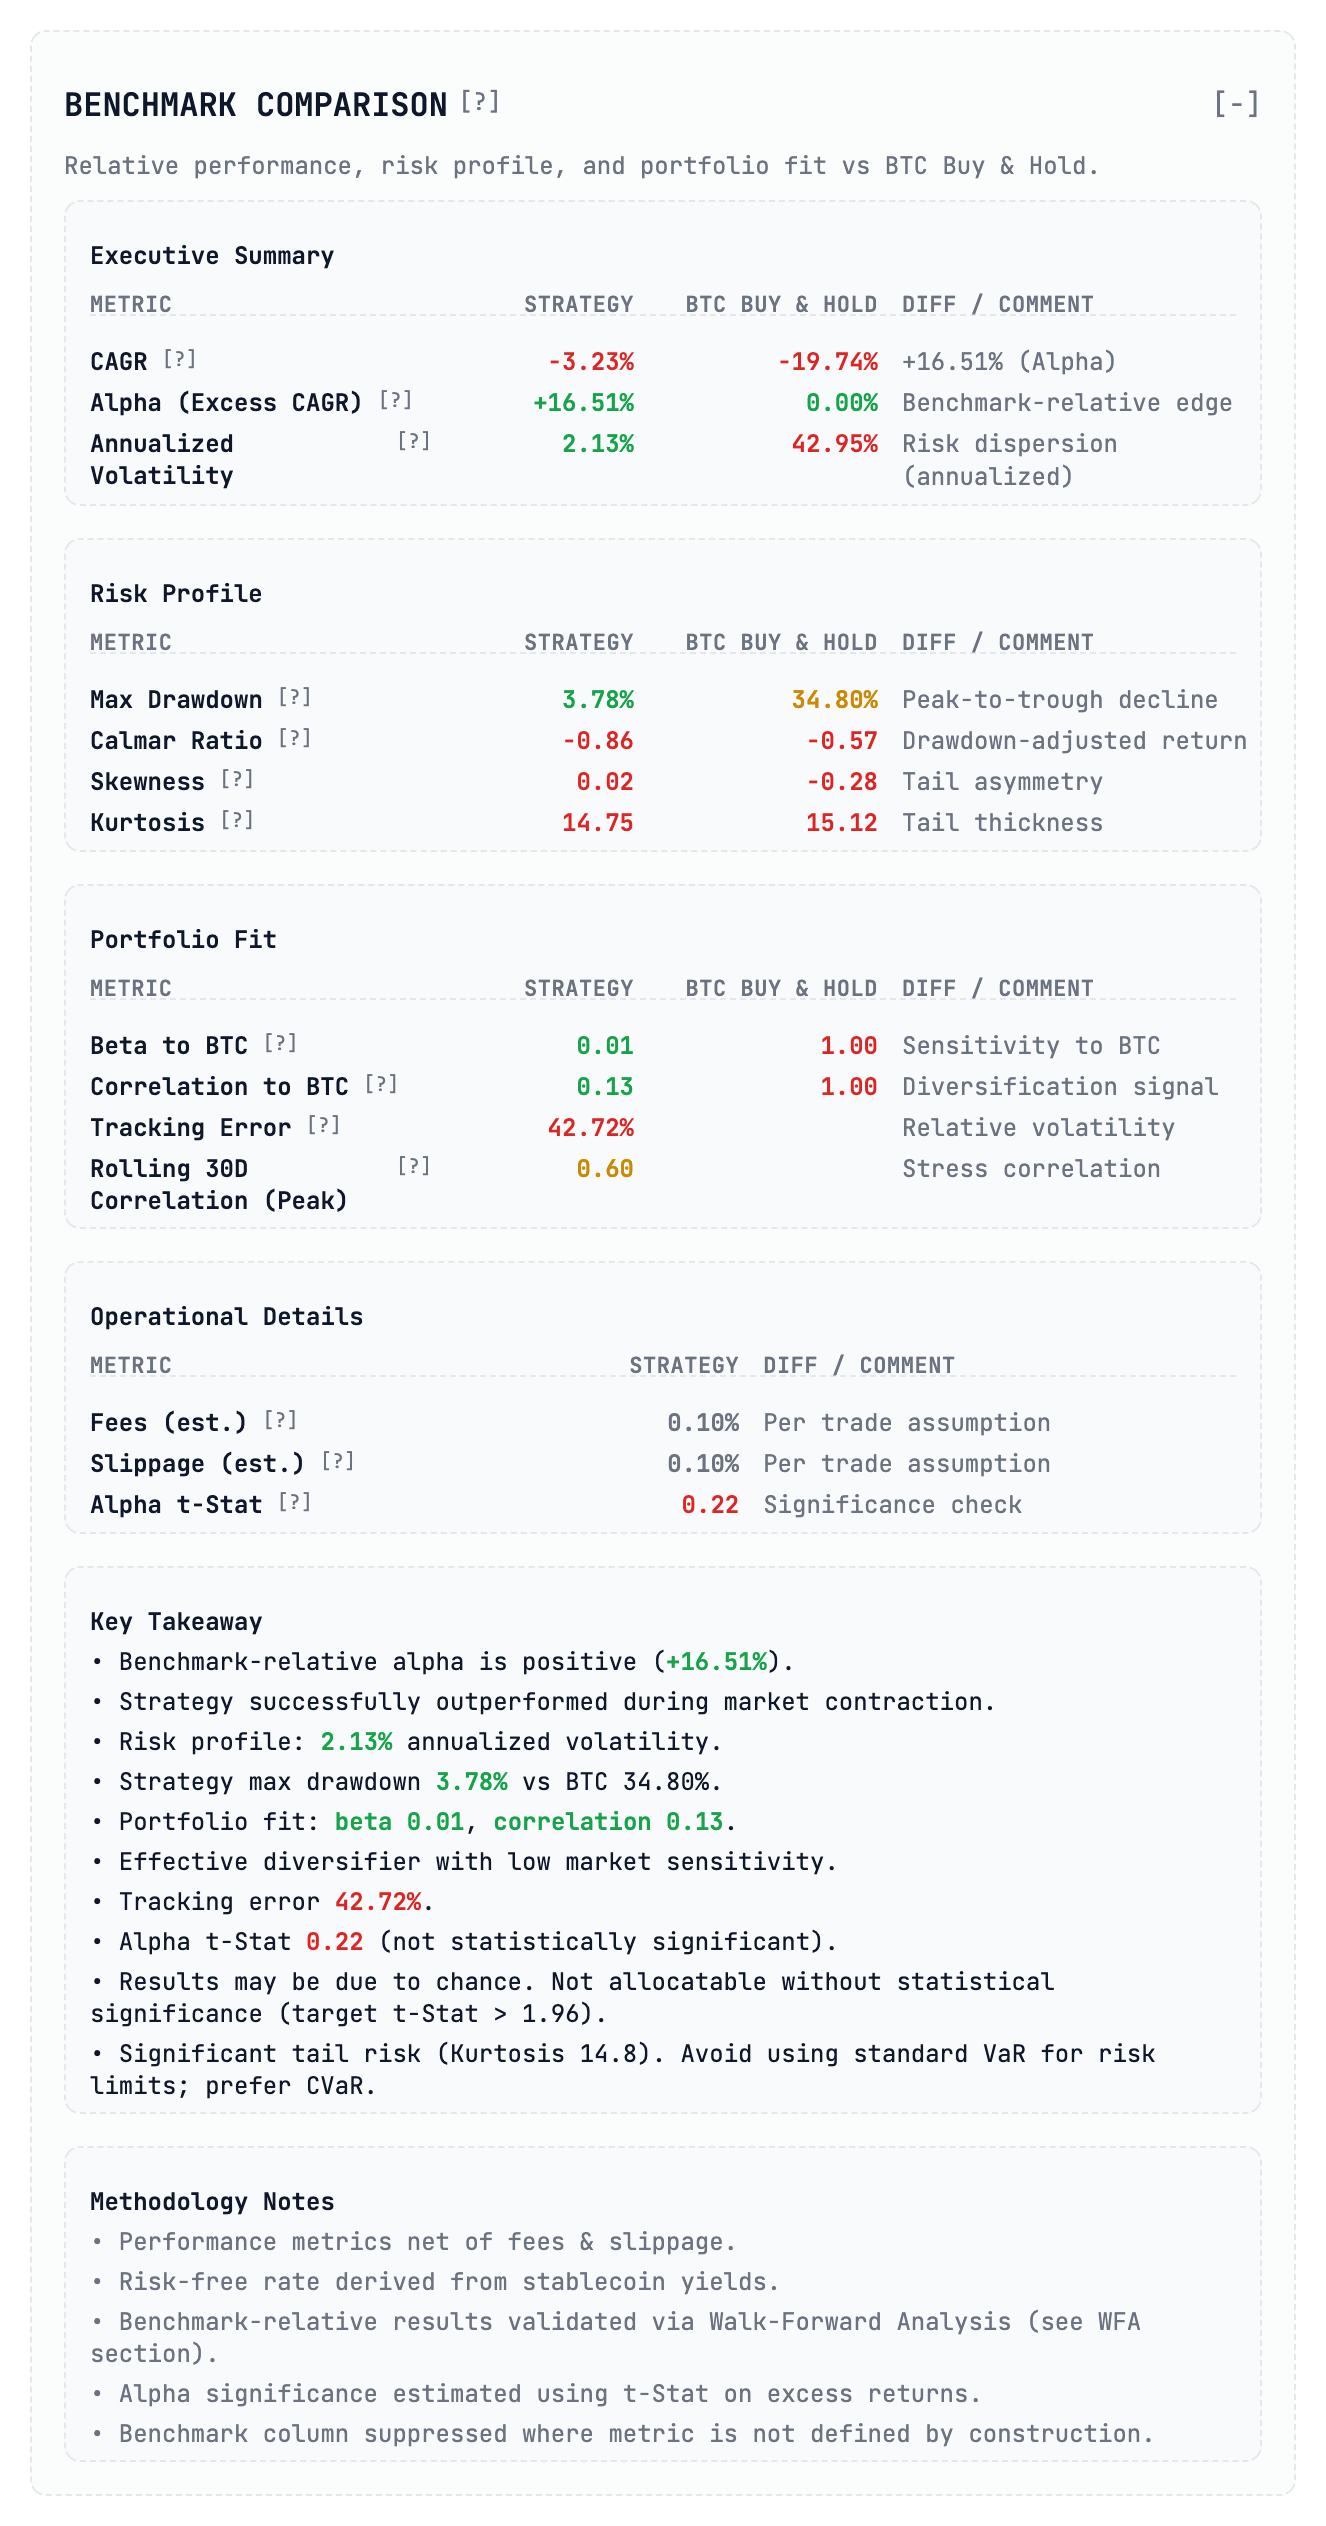
The first mistake most developers make is looking at absolute returns. If your bot made 20 % while Bitcoin made 50 %, you didn’t win; you just underperformed a passive index with higher risk.
In this analysis the strategy shows a CAGR of –3.23 %, but a benchmark‑relative alpha of +16.51 % because the market (BTC) crashed nearly 20 % during that period. On paper, outperforming a crashing market looks like a win.
The Guardrail: Look at the Alpha t‑Stat. In our report it sits at 0.22. In statistics anything below 1.96 is usually considered “noise” or luck. Despite the “alpha,” this strategy lacks statistical significance. It’s a fluke, not a system.
2. Walk‑Forward Validation: The Time‑Stability Test
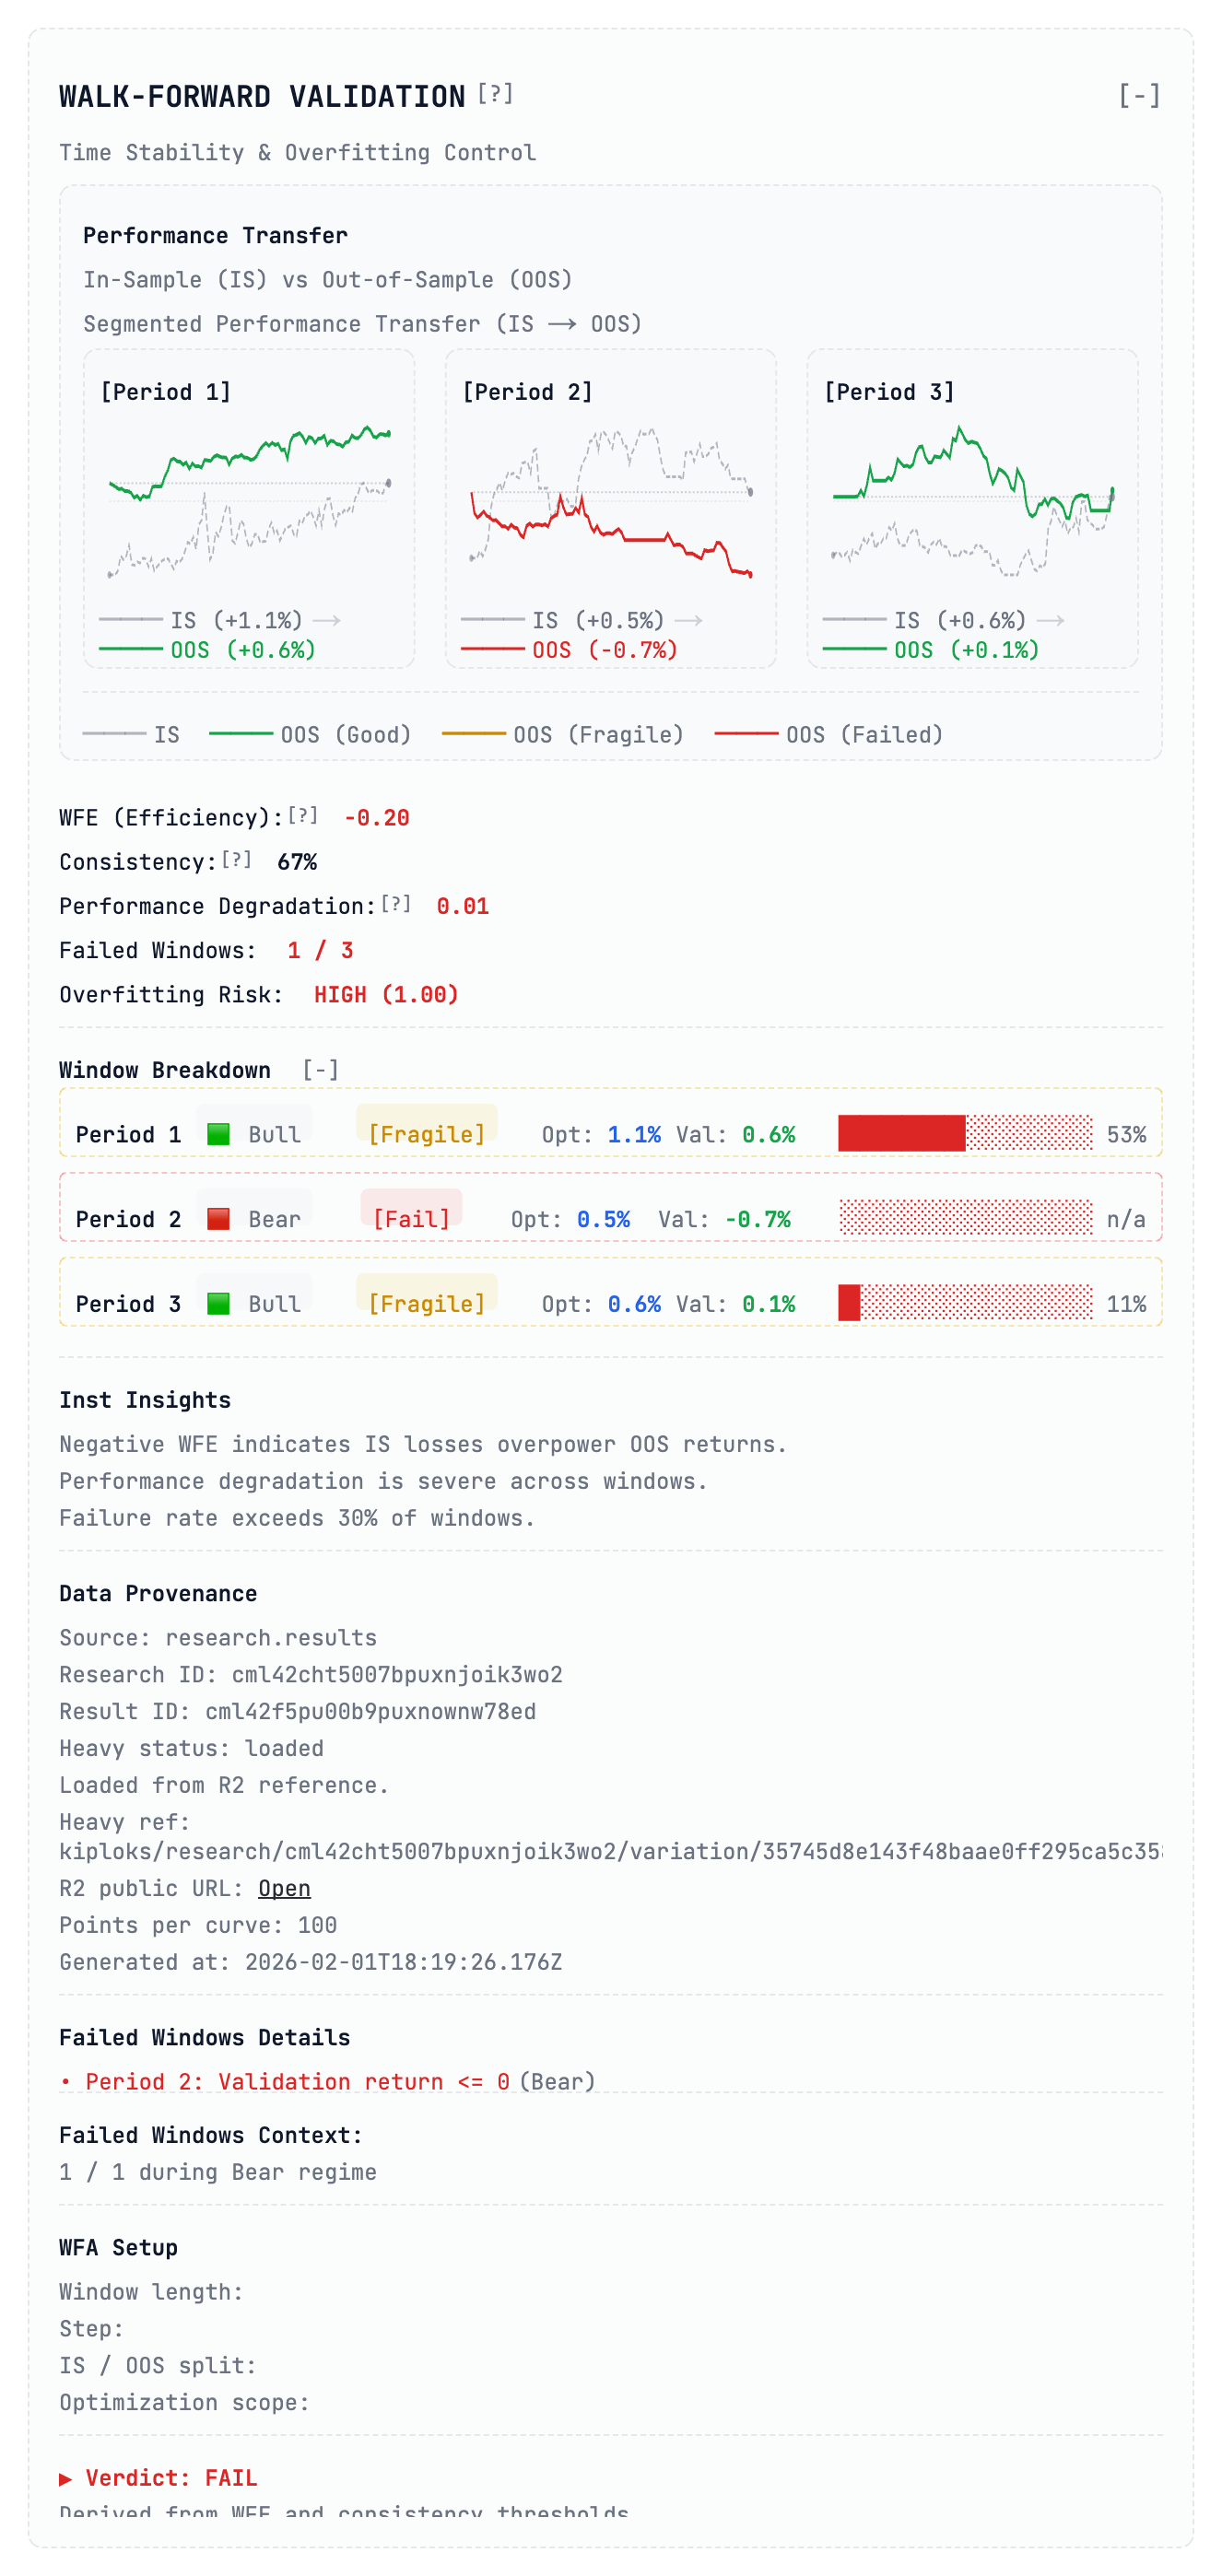
A static backtest is a lie. It treats the entire history as one block, but in reality markets move through distinct “regimes” (bull, bear, sideways).
When we run Walk‑Forward Validation, we optimize the model on one segment (in‑sample) and immediately test it on the following, unseen segment (out‑of‑sample). As you can see in the Performance Transfer charts, this strategy is a house of cards:
| Period | Market Regime | OOS Return | Guardrail Tag |
|---|---|---|---|
| 1 | Bull | +0.6 % | [Fragile] |
| 2 | Bear | –0.7 % | [Fragile] |
| 3 | Bull | Near break‑even | [Fragile] |
The Guardrail: We calculate WFE (Walk‑Forward Efficiency Ratio). In this case it’s –0.20. A negative WFE is a massive red flag—it means the losses during validation phases completely overpowered the gains. If a strategy’s performance is this dependent on a specific market “mood,” it isn’t an edge—it’s just a bet on a coin flip that you’ll eventually lose.
3. Trading Intensity: The “Exchange Support” Trap
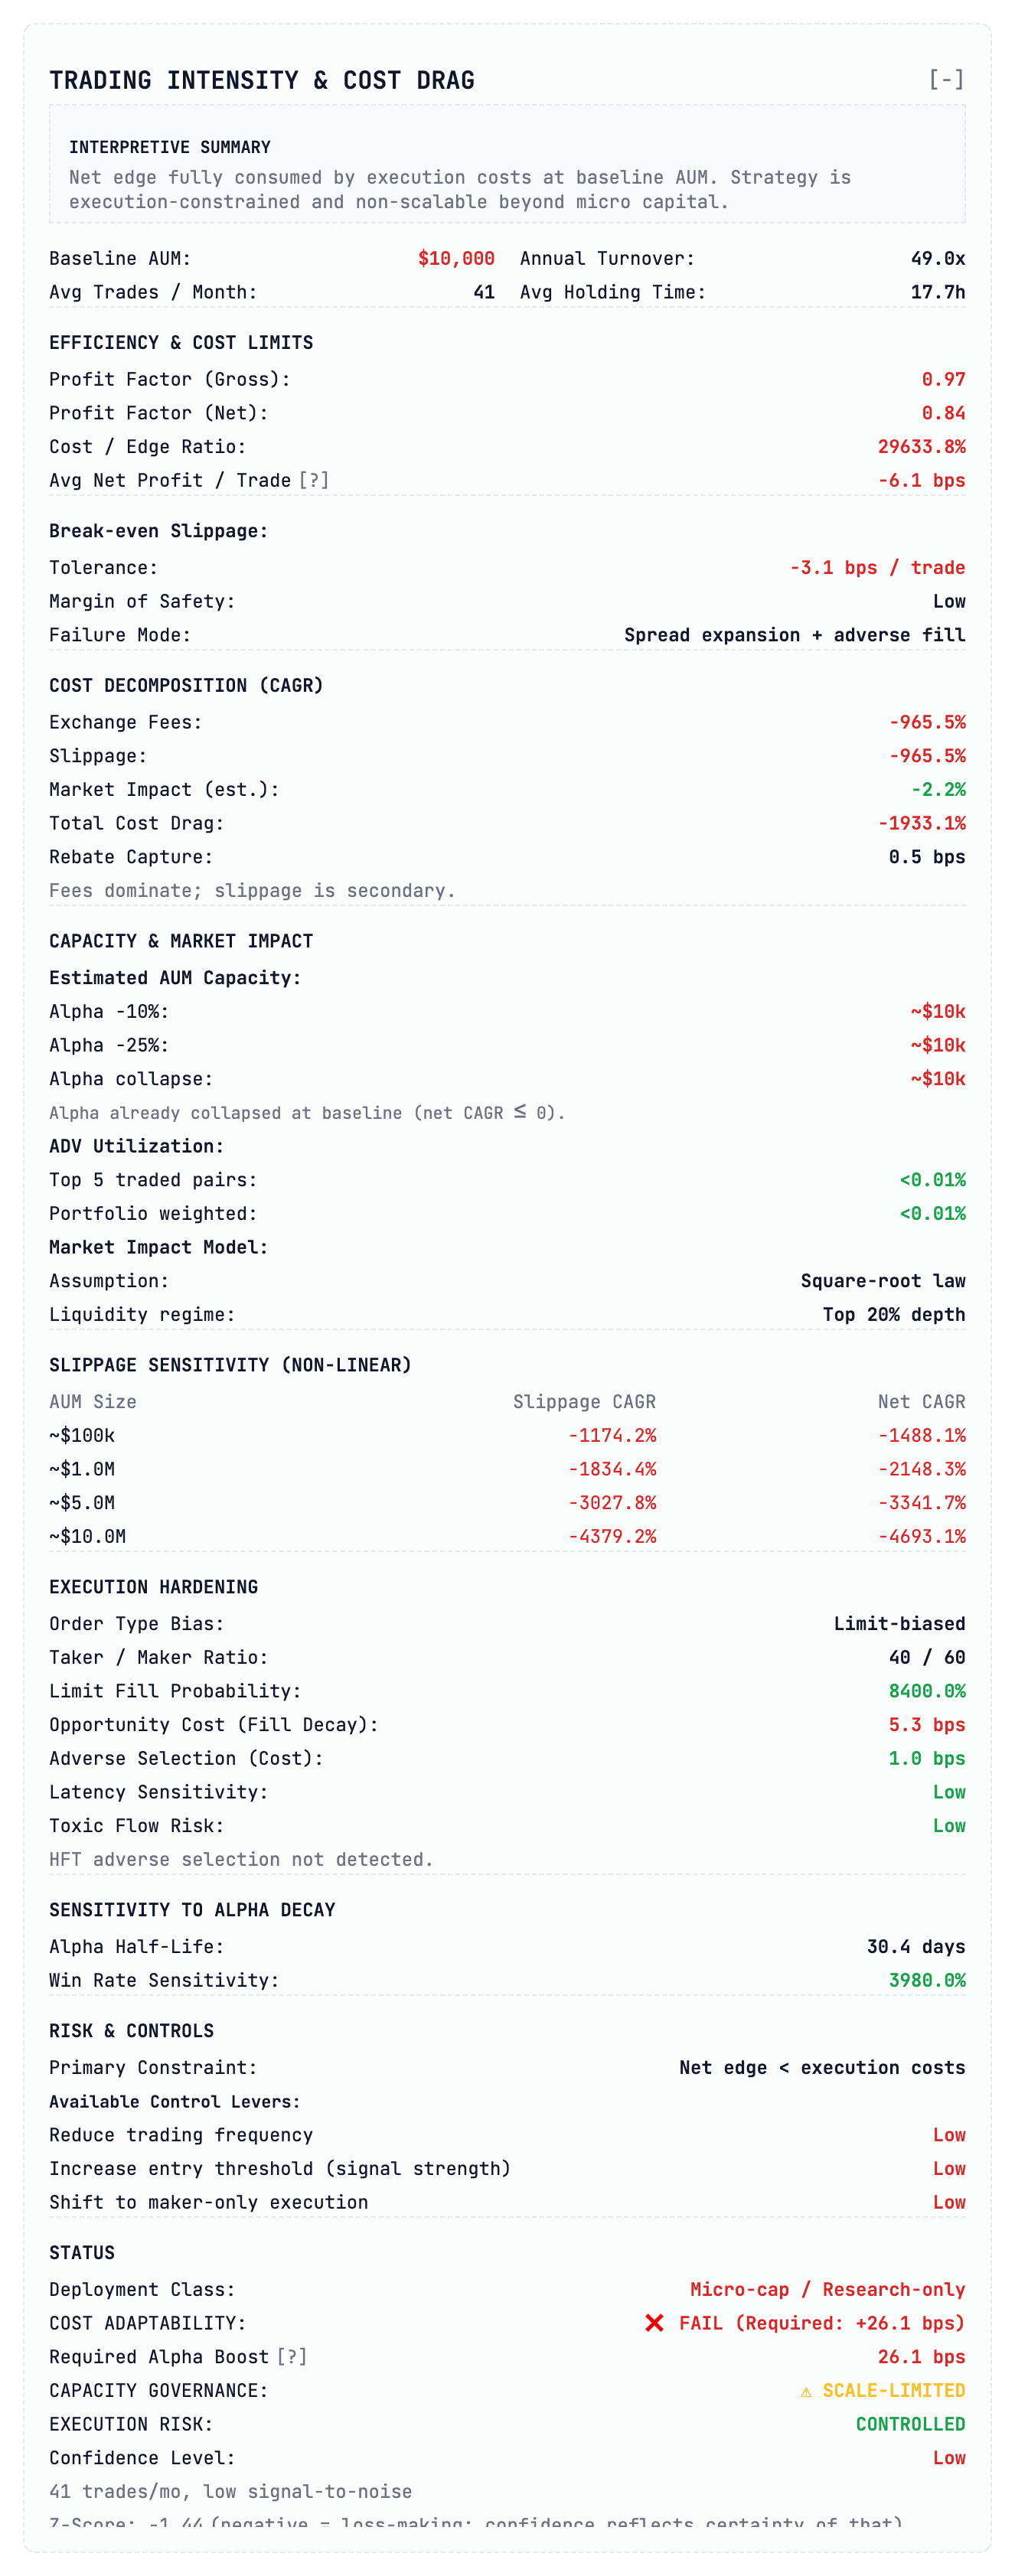
This is where “high‑frequency” or “grid” dreams go to die. Every time you trade, you pay. If your strategy trades too often with too little edge, you aren’t a trader—you’re a volunteer donor for the exchange.
Kiploks calculates the Cost / Edge Ratio. For this specific strategy the ratio is a staggering 296.3 %, meaning execution costs are nearly three times higher than the theoretical profit. Consequently, the average net profit per trade is –6.1 bps—you are losing money on every single fill.
The Guardrail: If your Net Profit Factor is below 1.0 (ours is 0.84), the strategy is fundamentally broken. We also look at the Total Cost Drag (–19.3 %) to see if the edge can survive real‑world friction. In this case the alpha collapses at baseline AUM. Verdict: UNTRADABLE.
4. Slippage Sensitivity: The Paper Tiger Table
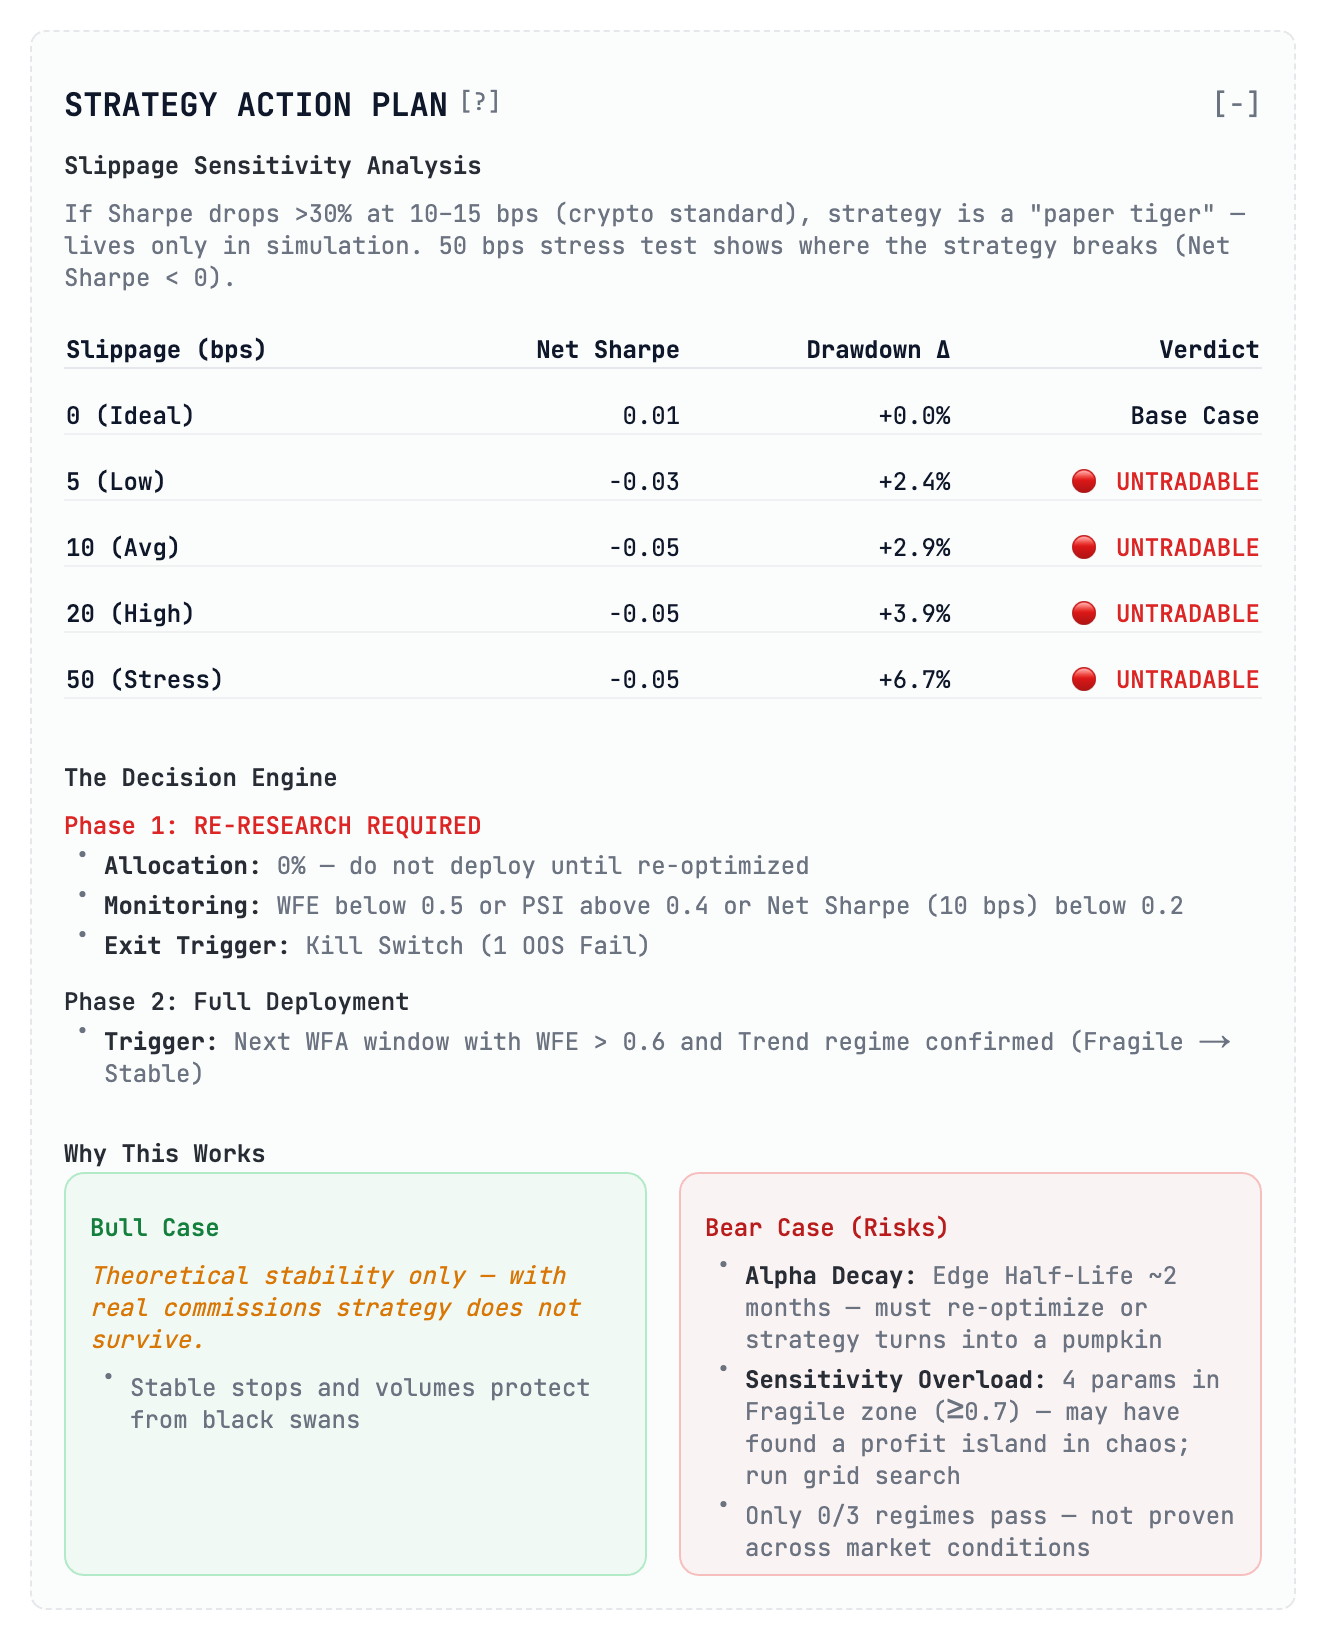
Most backtests assume you get exactly the price you see on the screen. In real crypto markets, “slippage” happens—you get filled at a worse price due to low liquidity or latency. If your strategy doesn’t have a built‑in execution buffer, it’s just a “paper tiger” that lives only in simulation.
We run a Slippage Stress Test to see how the strategy behaves when execution prices deviate from the mid‑price. The results (see the table above) show a rapid degradation of returns once slippage exceeds a few basis points, confirming that the edge cannot survive realistic market conditions.
Bottom line
Use these four guardrails—benchmark alpha significance, walk‑forward stability, trading intensity cost‑to‑edge, and slippage sensitivity—to weed out strategies that look good on paper but crumble in production.
Happy building, and may your live trades be ever‑lasting!
Where the strategy breaks
| Slippage | Effect |
|---|---|
| 0 bps (Ideal world) | The Net Sharpe is a measly 0.01 – even in a perfect world this is barely a strategy. |
| 10 bps (Average real world) | The Sharpe collapses to ‑0.05. You are losing money just by participating. |
| 50 bps (Stress) | Drawdown increases by +6.7 %, showing a complete lack of resilience. |
| The Guardrail | As a rule of thumb, if a Sharpe drops by more than 30 % at 10‑15 bps of slippage, the strategy is untradable. This specific model received an immediate UNTRADABLE verdict. It has zero margin for error and would likely liquidate an account in a real‑market environment. |
The Verdict So Far
By passing the strategy through just these four blocks, we’ve exposed a hard truth: a system that looked “okay” on a basic chart is actually a statistically insignificant, regime‑dependent, cost‑heavy machine that collapses at the first sign of real‑market slippage.
- Optimization would have told us to “tweak the entries.”
- Analysis tells us to stop research and change the logic.
What’s next?
In the next post I’ll dive into Parameter Robustness and Tail‑Risk Metrics – the final nails in the coffin for over‑fitted bots.
I am Radiks Alijevs, lead developer of Kiploks. I’m building these tools to bring institutional‑grade rigor to retail algorithmic trading. Follow me to see Part 2, where I’ll show the final robustness scoring.