When etcd crashes, check your disks first
Source: Hacker News
Insight from a Cloud‑Edge Continuum Testbed
Setting up a cloud‑edge continuum testbed for a computer‑vision demo taught us something fundamental about distributed systems:
etcddoesn’t forgive slow storage.
The Demo Setup
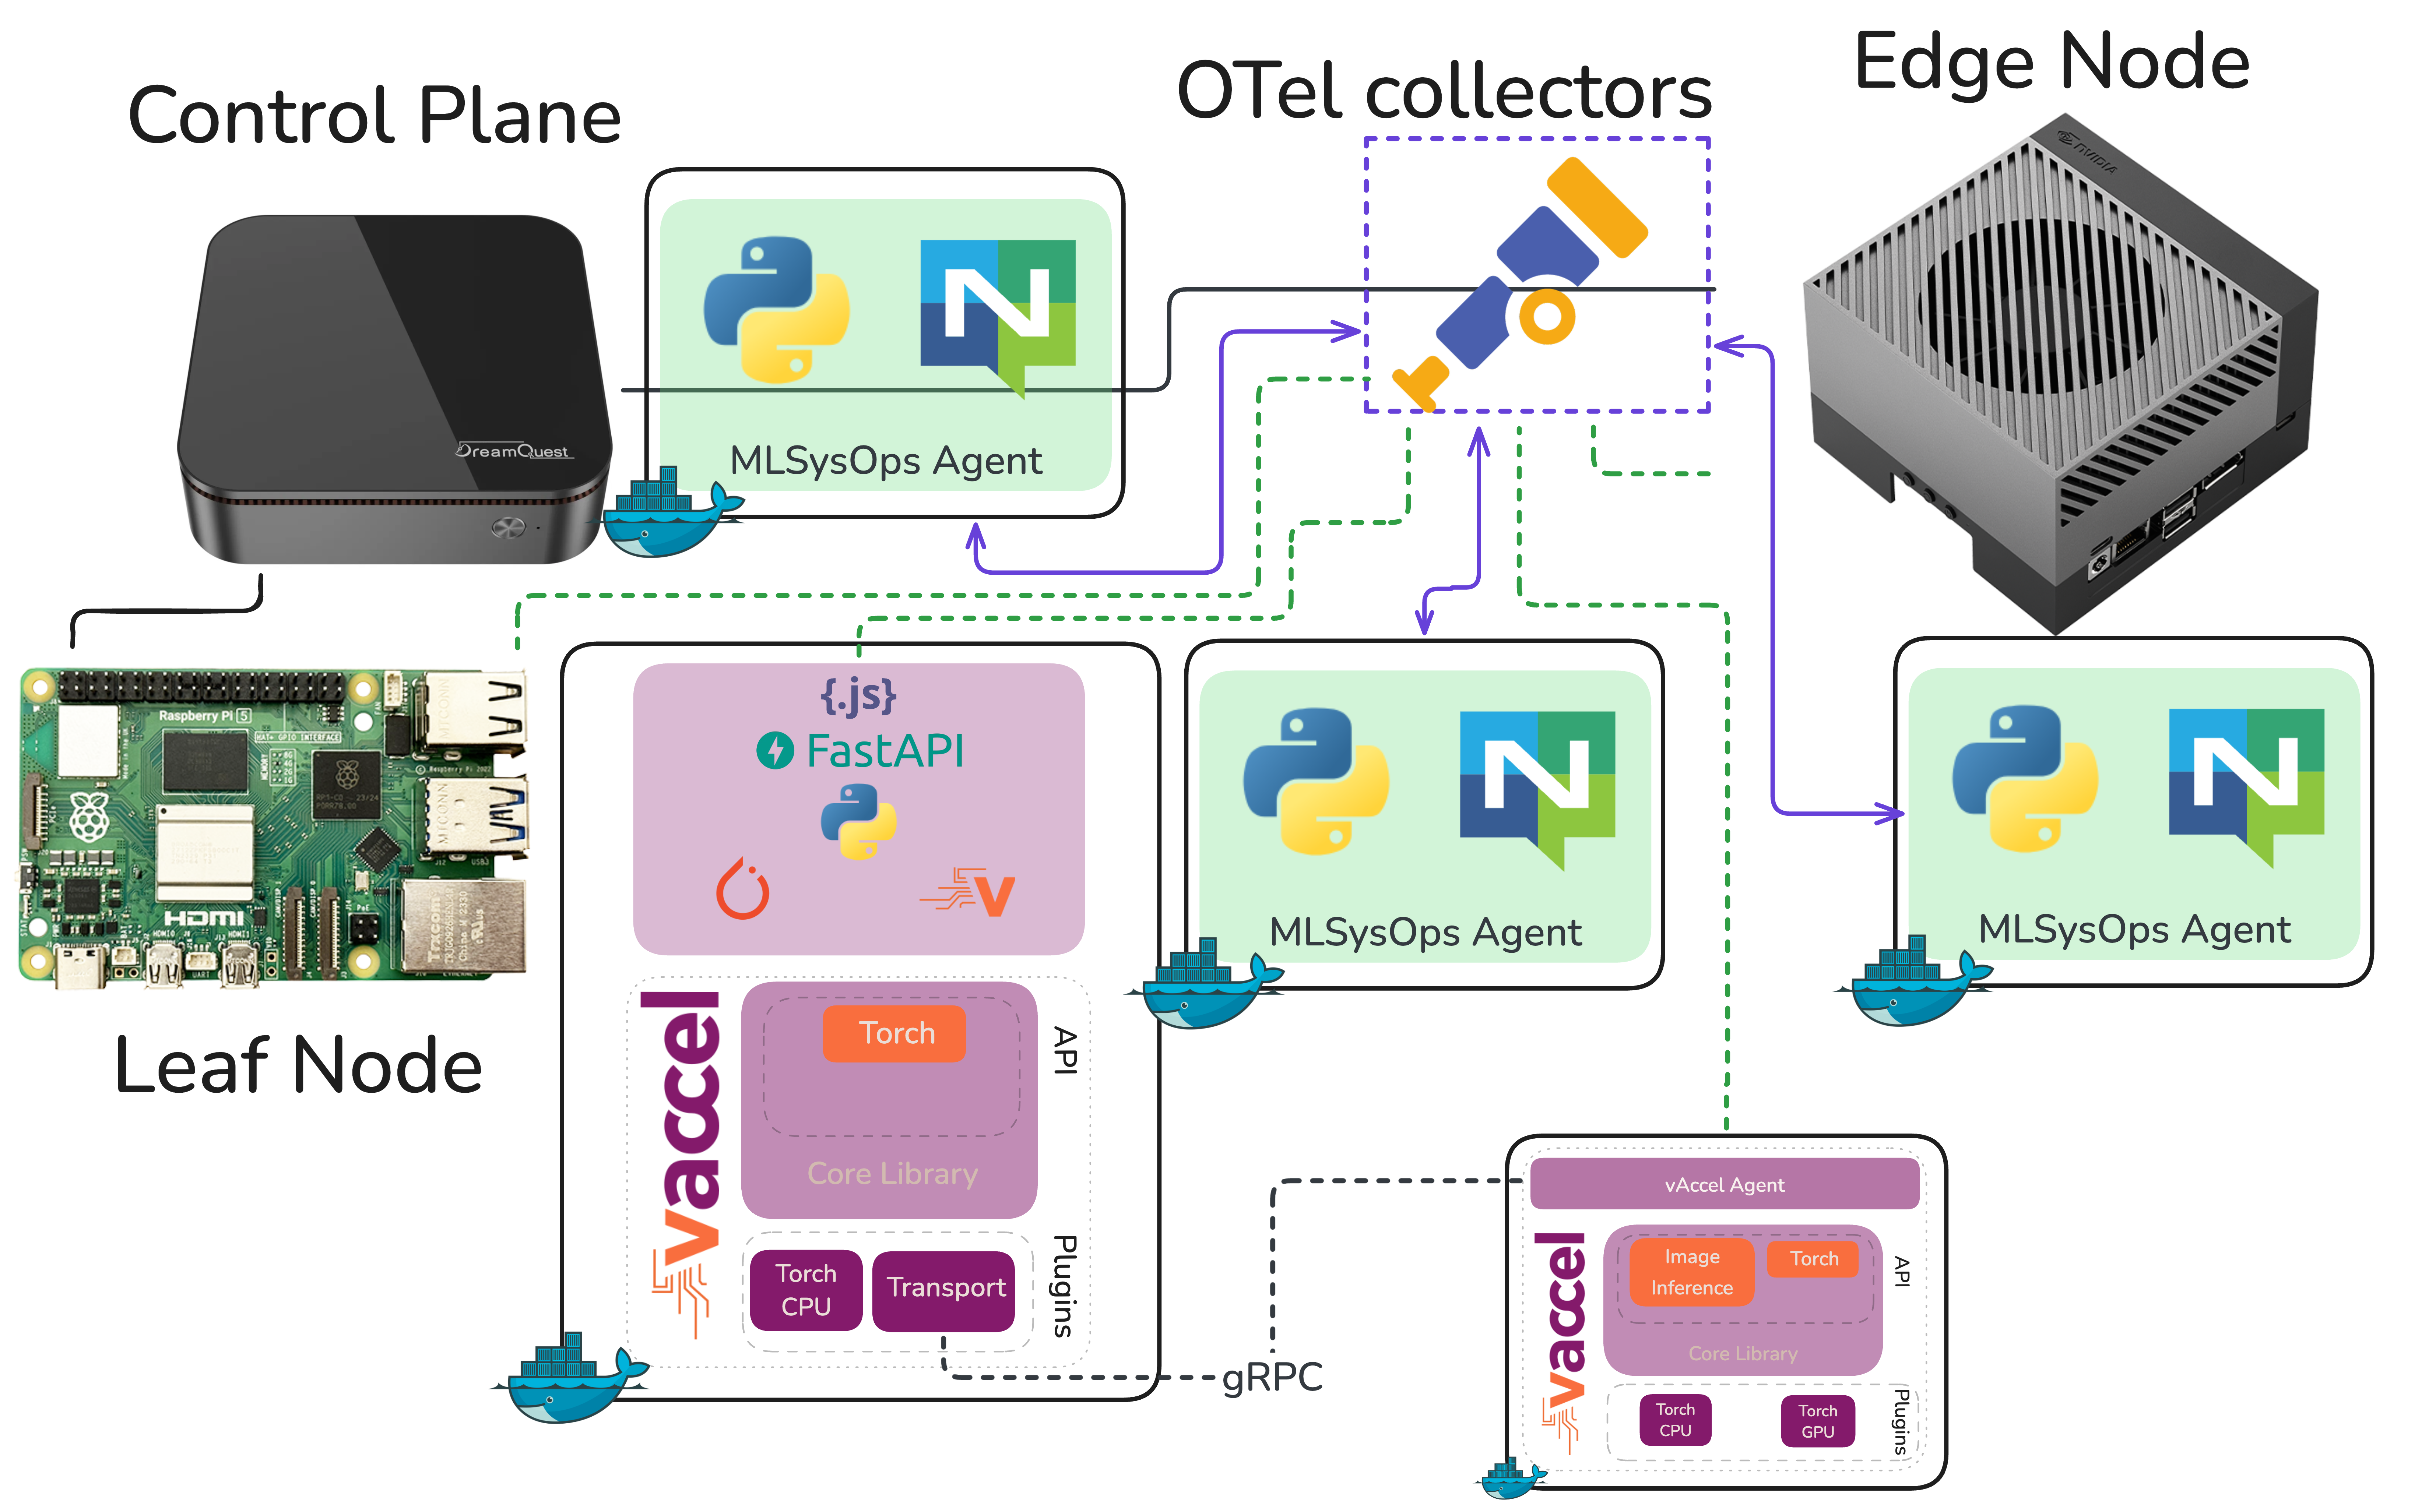
We’ve been building a demonstration for MLSysOps – a framework that enables custom policies (simple or ML‑based) to customize the deployment and runtime behavior of applications across the Cloud‑Edge‑IoT continuum.
The idea is to show how telemetry‑driven policies can dynamically adapt where and how an application runs, without the developer or operator having to intervene manually.
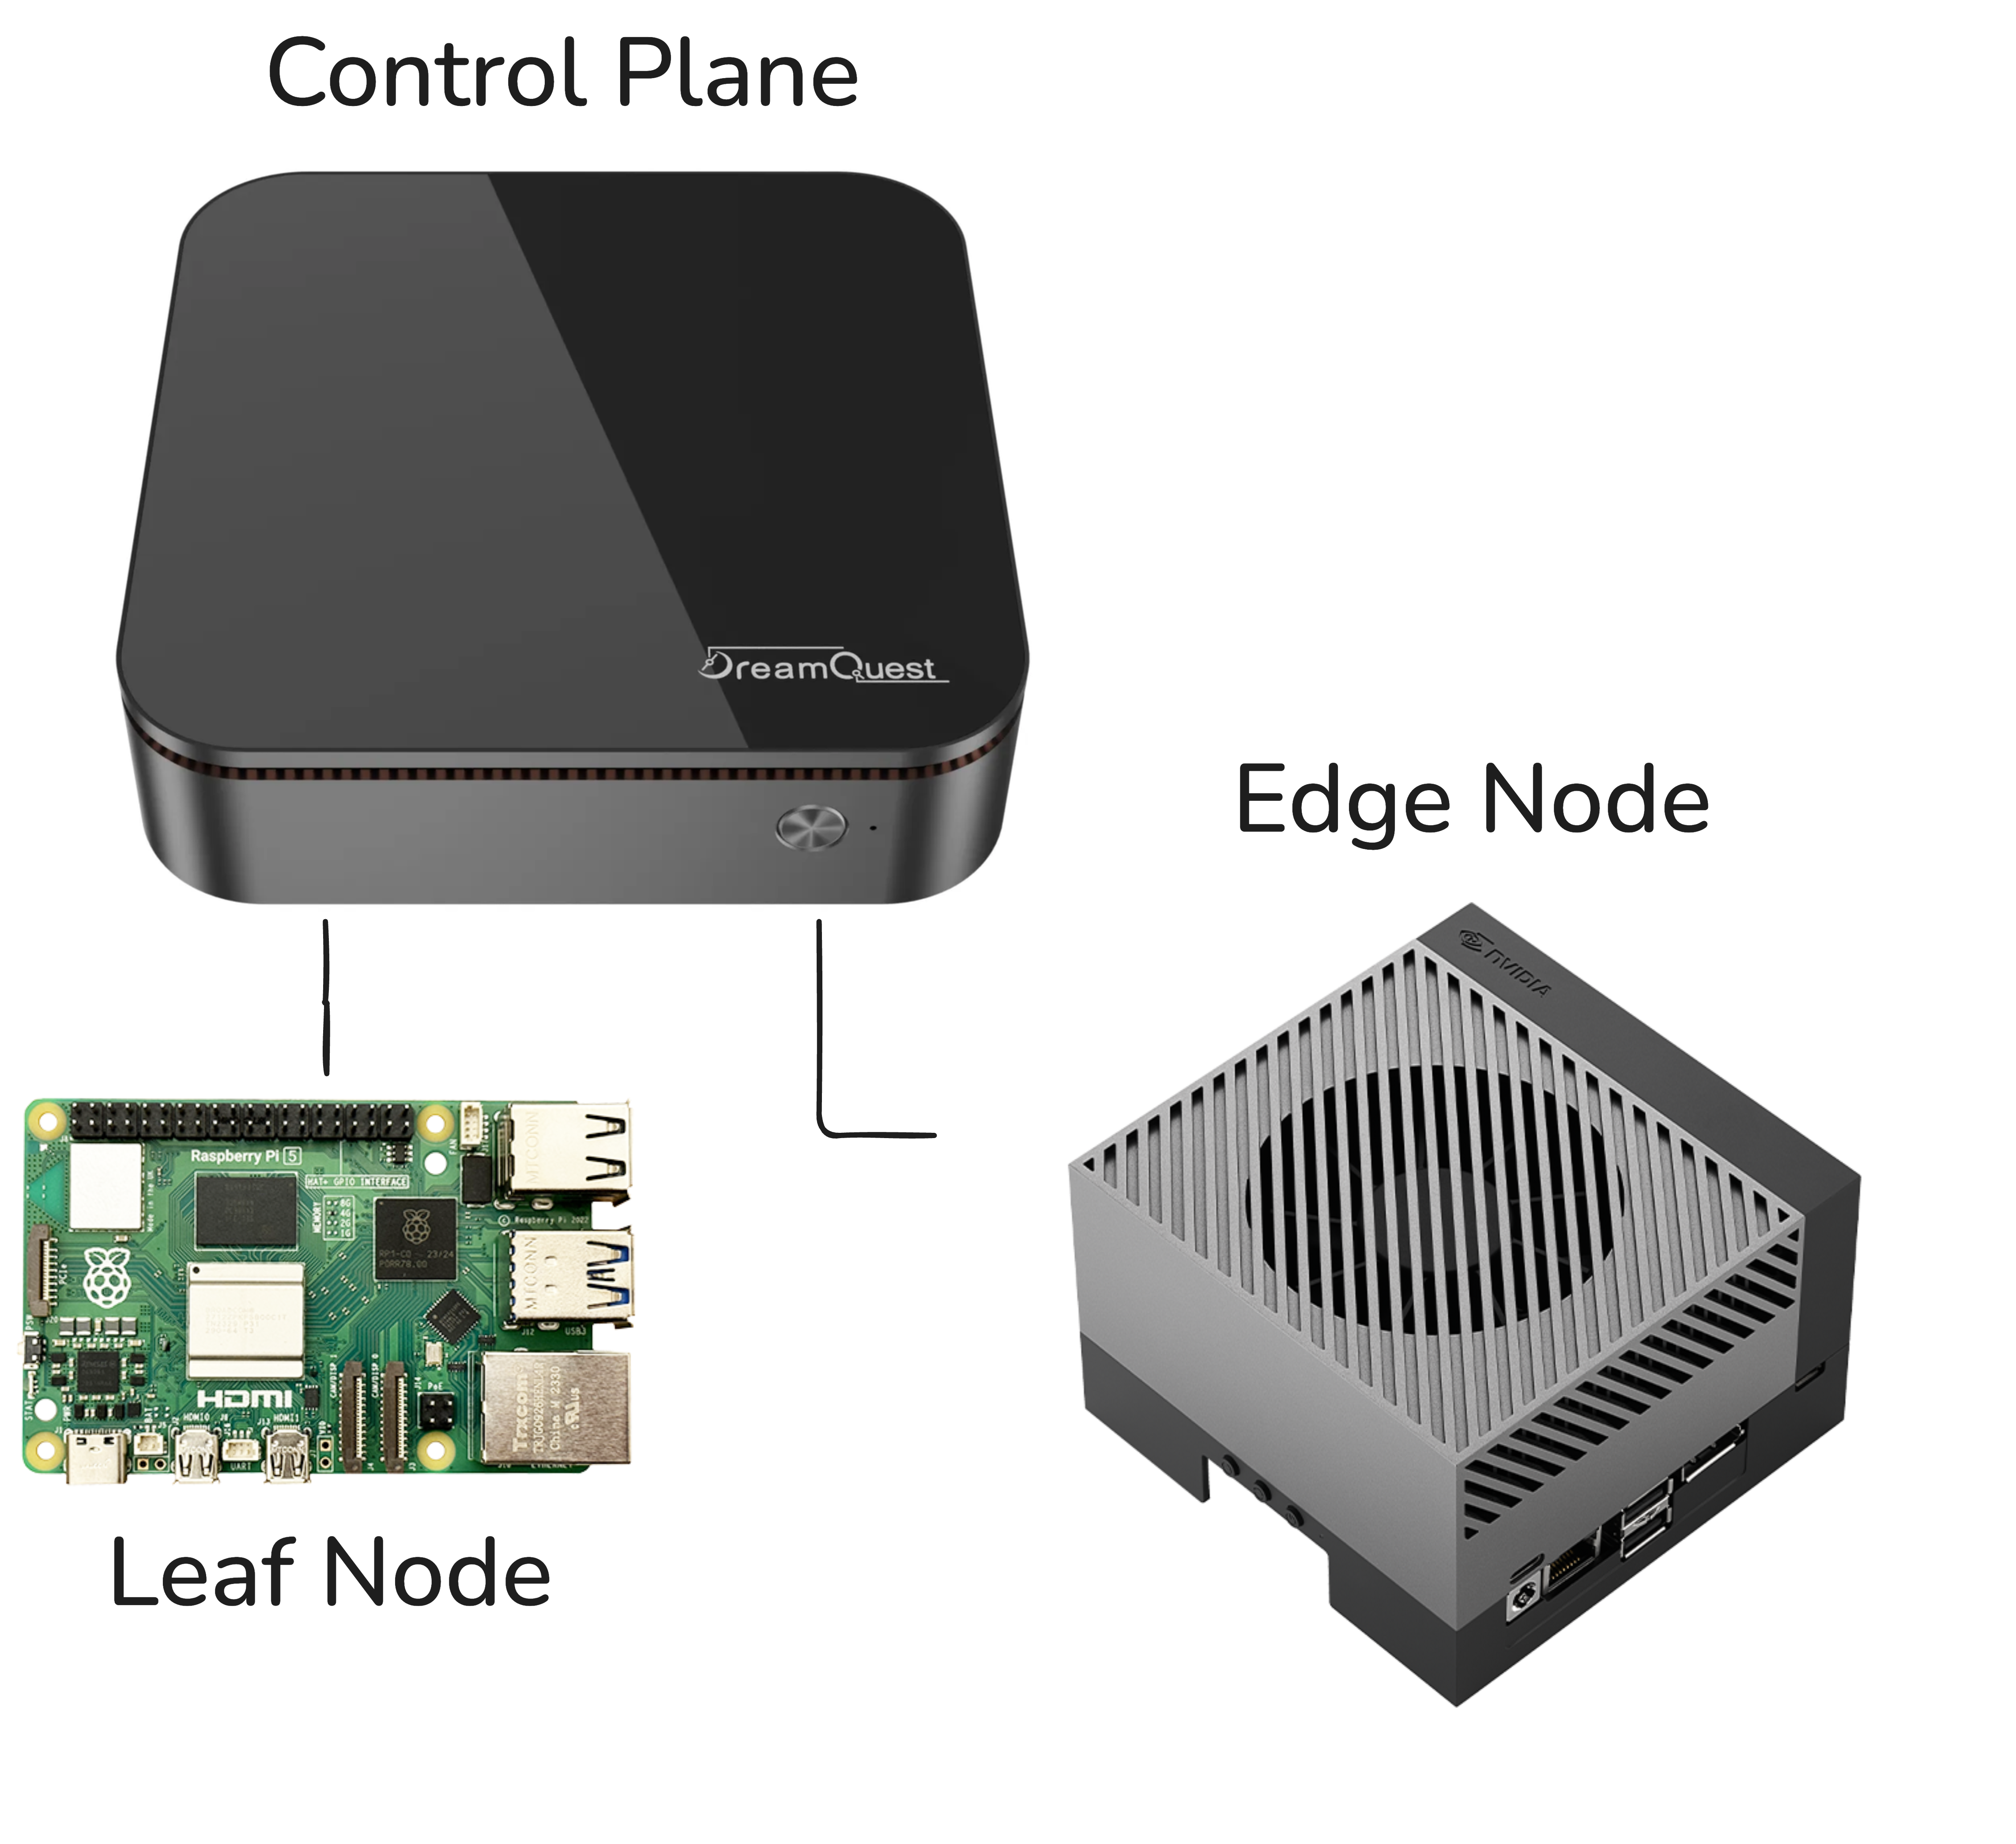
Architecture
- Continuum orchestrator: Karmada, sitting on top of individual k3s clusters.
- Application: A computer‑vision pipeline performing real‑time object detection.
- Hardware nodes:
- Intel NUC
- Raspberry Pi
- Jetson AGX Orin
More details on setting up the testbed are available in the MLSysOps GitHub repository.
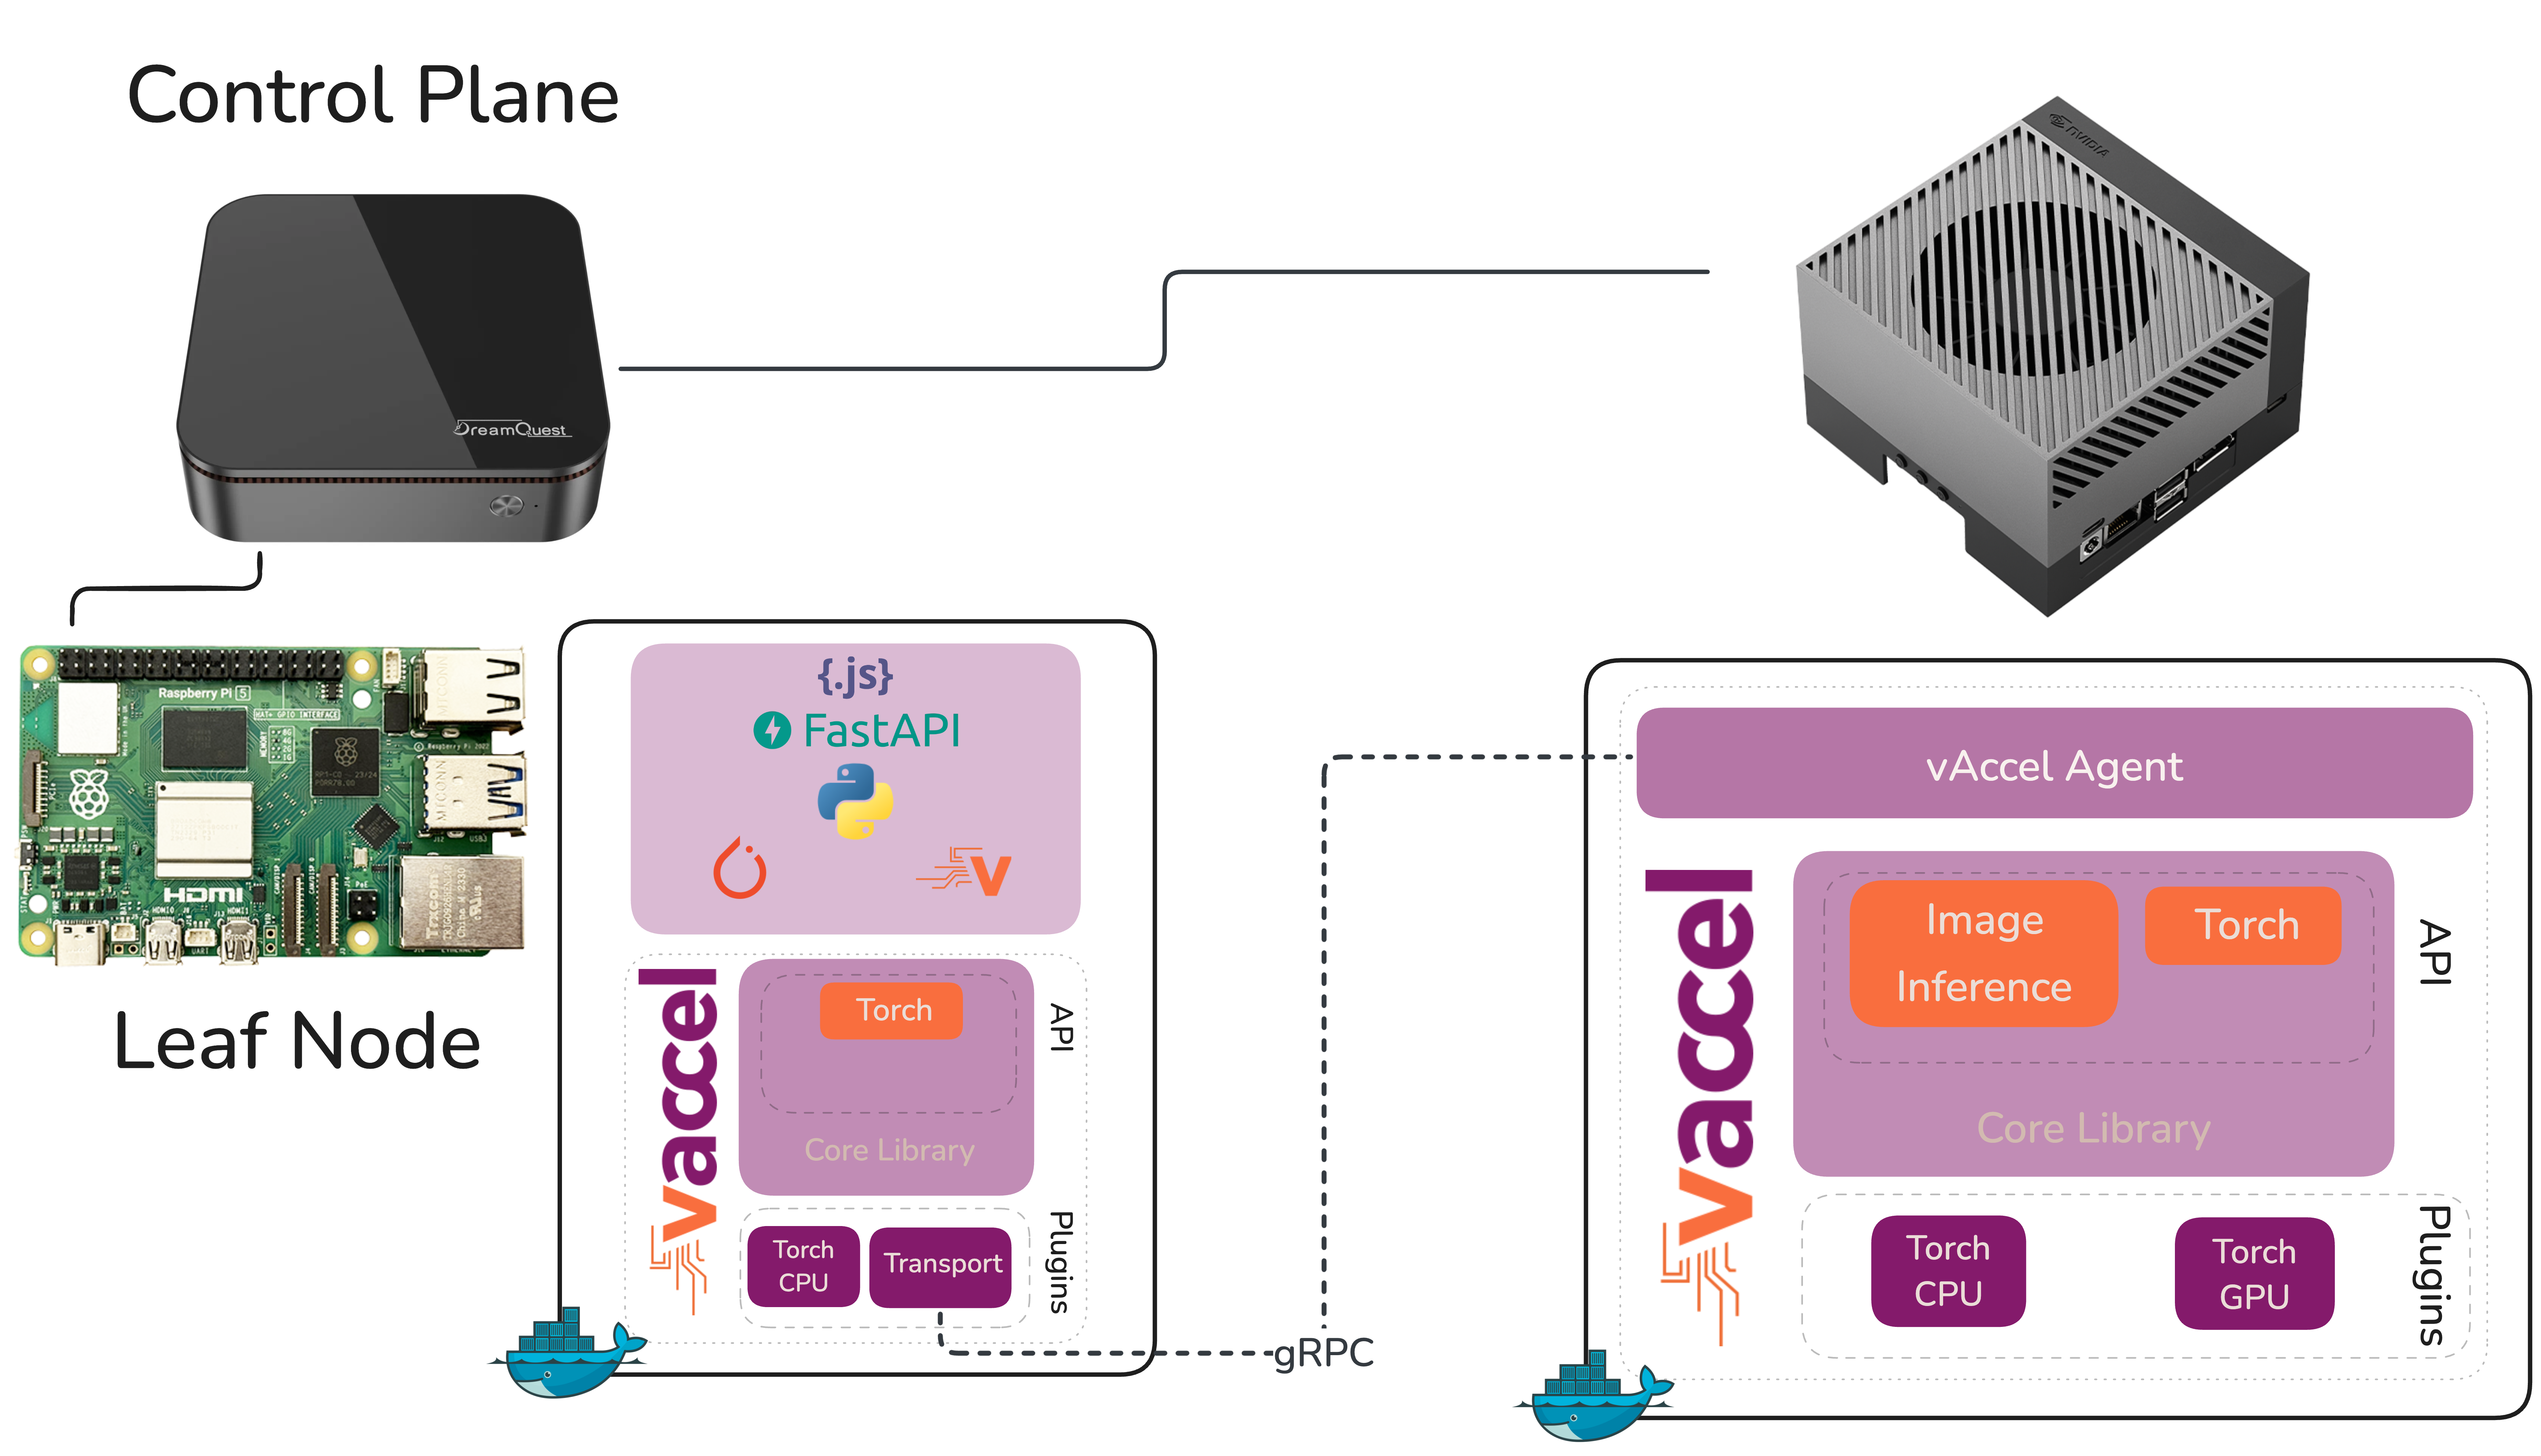
Demo Flow
- The object‑detection workload is deployed and runs locally on the Raspberry Pi.
- As the Pi starts to struggle (frame‑rate drops, inference latency climbs), the MLSysOps agents detect the degradation through telemetry.
- The policy transparently switches the vAccel backend to point at the Jetson AGX Orin.
- The workload is offloaded to the powerful GPU, real‑time object detection resumes, and the only change is the policy enforcement – no redeployment, no manual intervention.
What We Learned
Before we could tell that story, we first had to get the cluster up and running – and that turned out to be more interesting than we expected.
A Four‑Node Cluster on Three Physical Machines
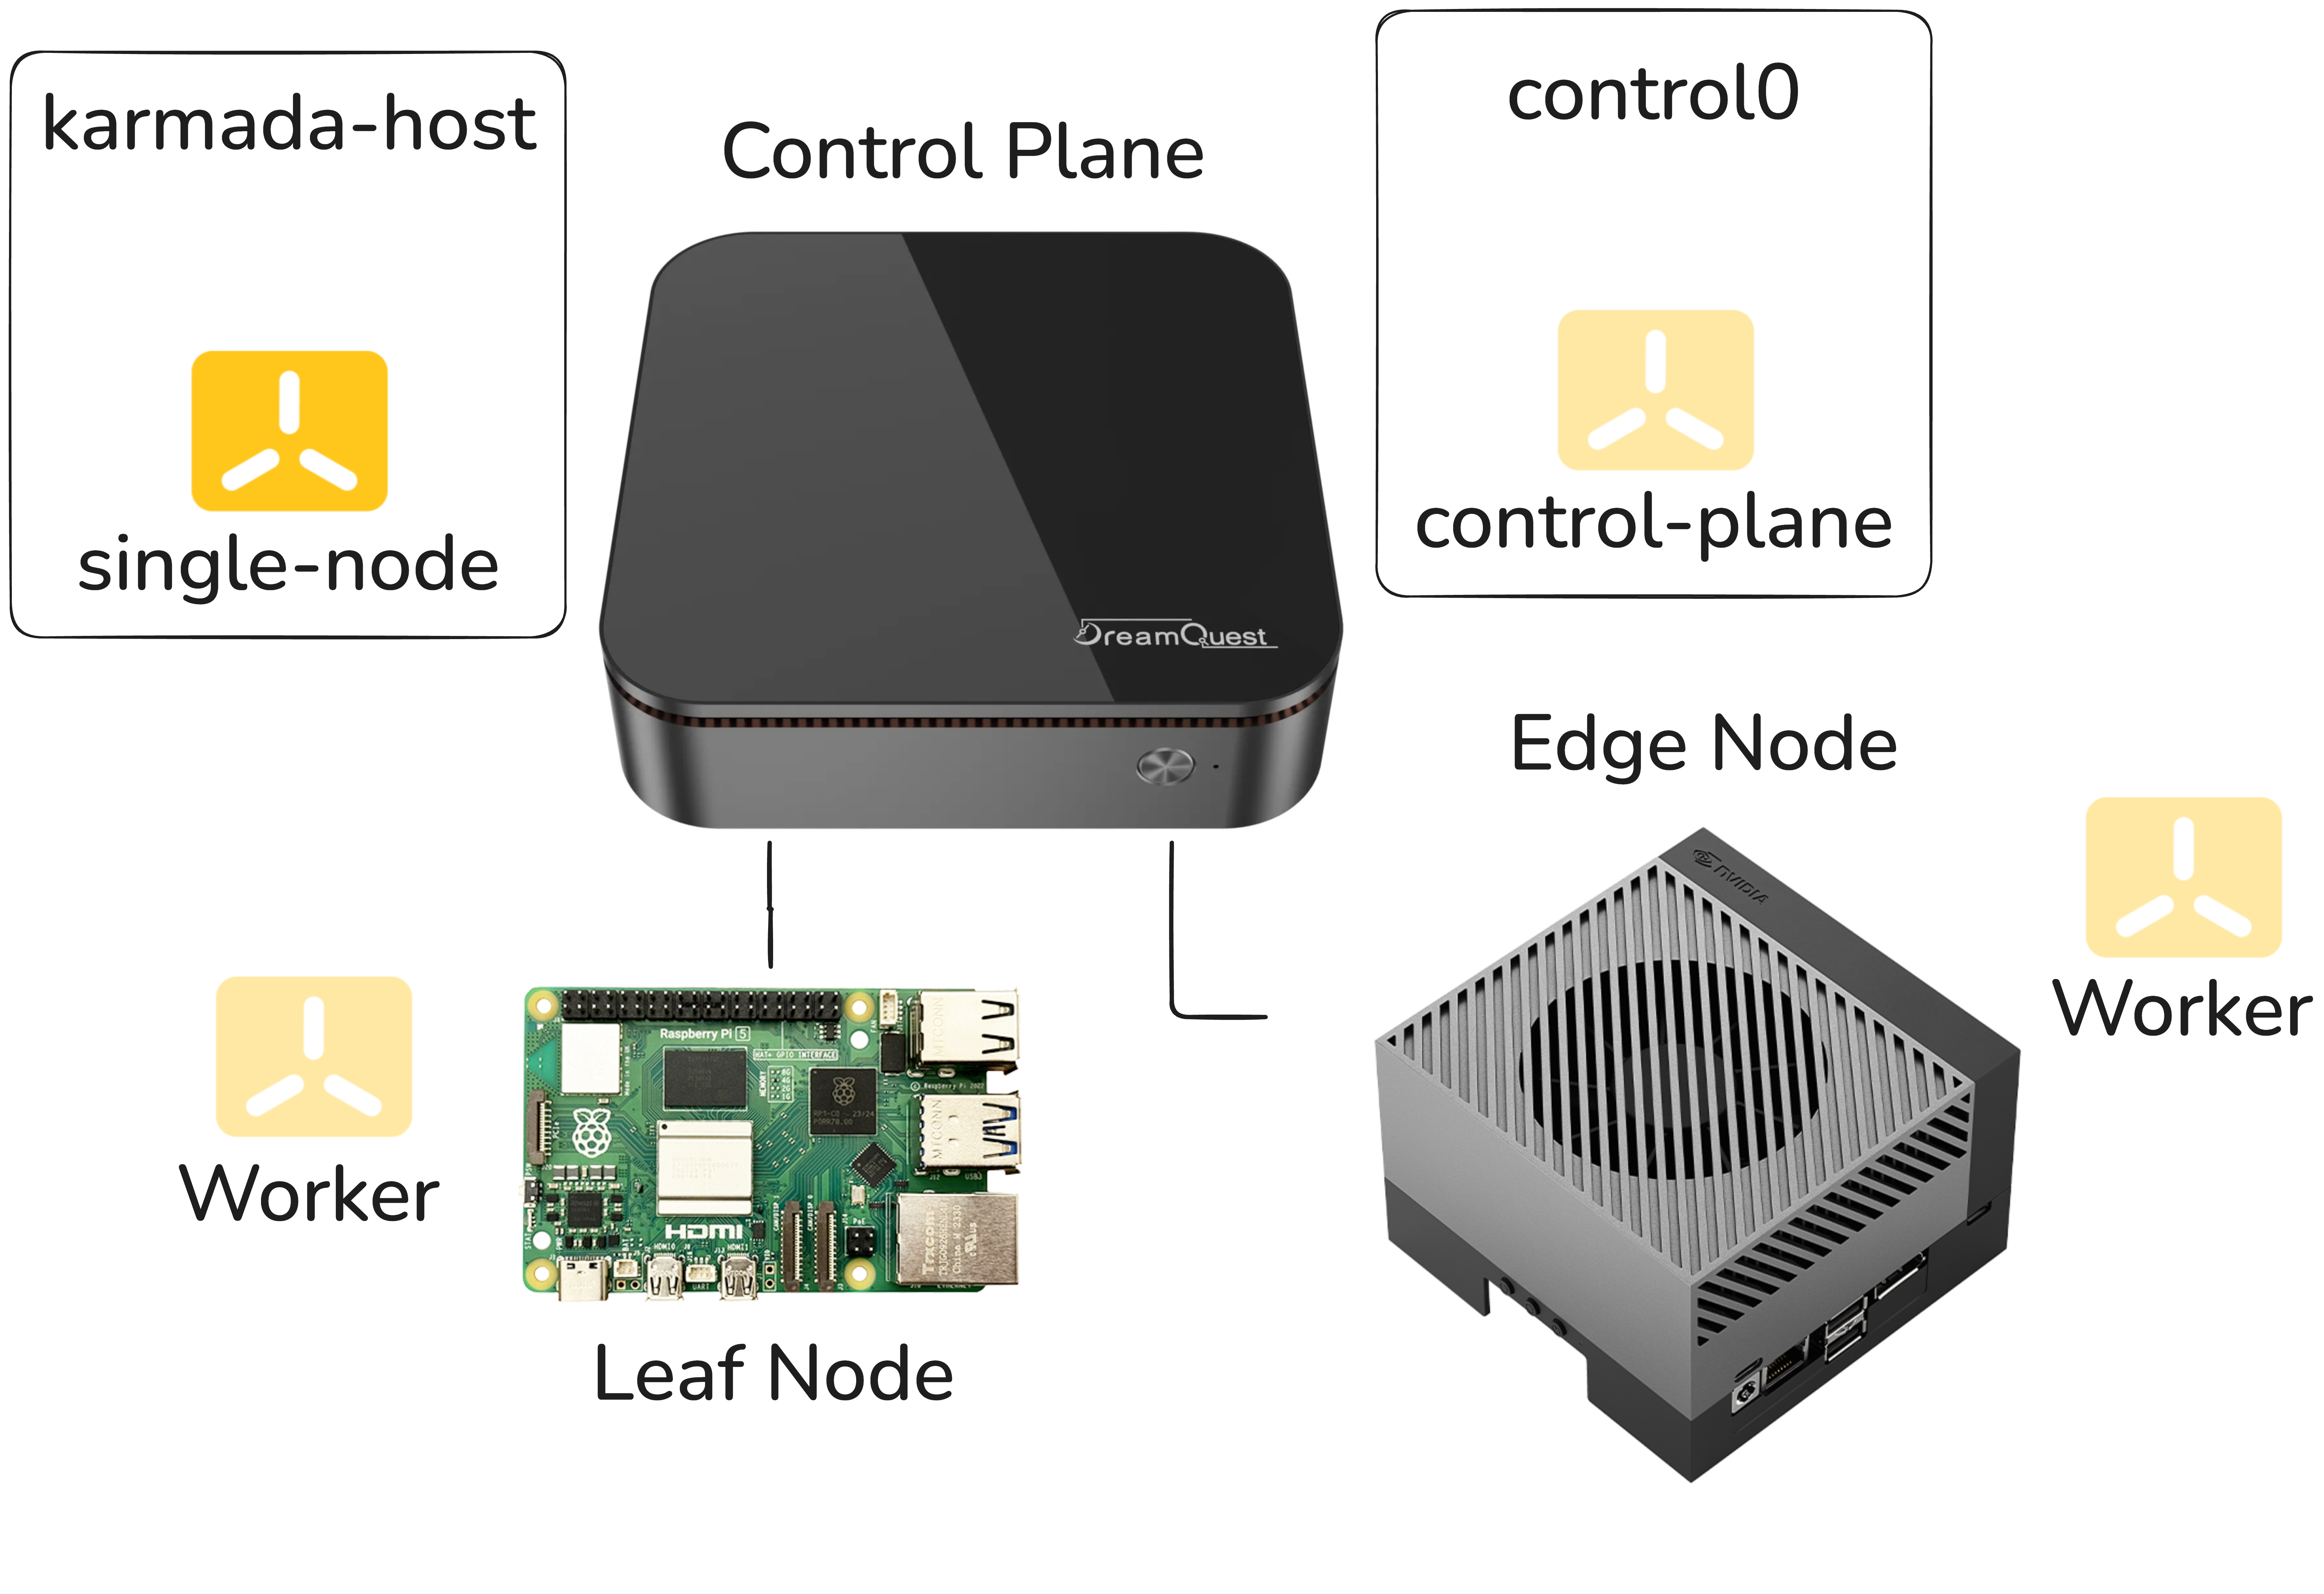
Karmada stores its own state in etcd, separate from the etcd instances that back each individual Kubernetes cluster. In k3s this etcd is embedded in the k3s binary, so we don’t need to manage separate etcd processes.
Because Karmada’s host must run its own etcd, it has to be a dedicated node, distinct from the clusters it orchestrates. With only three physical machines available and a desire to keep the demo self‑contained, we adopted the following layout:
| Physical machine | Role(s) |
|---|---|
| NUC | • VM 1 – Karmada host (etcd) • VM 2 – k3s control‑plane |
| Raspberry Pi | Worker node for the k3s cluster |
| Jetson | Worker node for the k3s cluster |
This arrangement is logical and pragmatic, but it also introduced a subtle problem that we later uncovered.
The Symptom: Pods That Wouldn’t Stay Up
After getting Karmada installed, we started noticing that Karmada’s own pods were crashing every five to ten minutes—regularly, predictably, maddeningly.
The crashes weren’t immediately informative. The pods would come back up, run for a while, and crash again. Nothing in the application layer seemed wrong.
The k3s clusters themselves looked healthy. We went through the usual suspects—resource limits, networking, configuration drift between restarts—and came up empty.
The investigation got genuinely pedantic. We started pulling on every thread we could find in the logs, correlating timestamps, and looking for patterns in what was dying and when.
The Root Cause: etcd and I/O Latency
Eventually the logs pointed somewhere unexpected: etcd was timing out.
It wasn’t crashing because of a bug or a mis‑configuration in the Karmada setup itself, but because the underlying storage wasn’t responding fast enough for etcd’s expectations.
etcd is a strongly consistent, distributed key‑value store, and that consistency comes at a cost: it is extraordinarily sensitive to I/O latency. It uses a write‑ahead log and relies on fsync calls completing within tight time windows. When storage is slow—even intermittently—etcd starts missing its internal heartbeat and election deadlines, leader elections fail, the cluster loses quorum, and pods that depend on the API server begin to die.
The VMs on the NUC were sharing the host’s storage, and under the default configuration the I/O performance wasn’t consistent enough to keep etcd happy. Bumping the etcd timeout thresholds helped a little but didn’t solve the problem; it merely moved the failure threshold. The real issue was the storage itself.
The Fix: ZFS Tuning on the NUC
After optimizing the ZFS storage backend—adjusting settings that affect how aggressively writes are committed and how I/O is scheduled—the latency profile improved enough that etcd stopped timing out, the pod crashes ceased, and the cluster became stable.
The following ZFS properties were applied to the dataset that backs the VMs:
zfs set sync=disabled      default   # Disable synchronous writes
zfs set compression=lz4    default   # Use fast LZ4 compression
zfs set atime=off          default   # Disable access‑time updates
zfs set recordsize=8k      default   # Smaller record size for etcd writes
What each setting does
| Setting | Effect | Why it helps etcd |
|---|---|---|
sync=disabled | ZFS acknowledges writes immediately without waiting for the data to be physically flushed to disk. | fsync calls return instantly, eliminating the latency that caused etcd timeouts. (Risk: recent writes could be lost on power loss.) |
compression=lz4 | Enables transparent LZ4 compression. | Reduces the amount of data written to disk; LZ4 is fast enough that CPU overhead is negligible, improving overall I/O throughput. |
atime=off | Disables updating the “last access time” on every read. | Prevents read‑heavy workloads from generating extra writes, lowering I/O pressure. |
recordsize=8k | Sets ZFS block size to 8 KB (default is 128 KB). | Aligns ZFS I/O units with etcd’s small, random reads/writes, reducing write amplification. |
Together these settings tell ZFS to stop being overly cautious and be fast. sync=disabled is the primary factor that stopped the etcd crashes; the other three settings provide additional I/O relief and are generally good housekeeping for performance‑tuned workloads.
Note: In a production environment you would need to weigh the risk of
sync=disabled(potential data loss on power failure) against the performance gains. For a demo VM on shared storage, the trade‑off is acceptable, but a productionetcdcluster should use a more durable configuration.
The Lesson: When etcd Crashes, Look at Your Disks
This is the pattern worth internalizing. If you’re running Karmada (or any Kubernetes‑adjacent system that embeds etcd) and you’re seeing periodic pod crashes that don’t have an obvious application‑level cause, the first question to ask is:
How is the storage performing under etcd’s workload?
The etcd documentation actually calls this out: it recommends SSDs and warns against running etcd on storage that’s shared with other I/O‑heavy workloads.
- In a production cluster you’d typically have dedicated storage for
etcdnodes. - In a demo environment running VMs on shared hardware, that’s easy to overlook.
Diagnostics to Run
-
Prometheus metrics –
etcdexposes a rich set of metrics. The ones to watch are:etcd_disk_wal_fsync_duration_secondsetcd_disk_backend_commit_duration_seconds
If the 99th percentile of either metric is consistently > 100 ms, you have a storage problem, not a configuration problem.
-
Storage benchmark – Before installing
etcdon a machine, run a quick benchmark against the storage path it will use. A tool likefiocan give you a baseline read/write latency profile.
# Example fio command (adjust path, size, and runtime as needed)
fio --name=etcd-bench --filename=/var/lib/etcd/data \
    --rw=randwrite --bs=4k --iodepth=32 --numjobs=4 \
    --time_based --runtime=60 --group_reporting
If the benchmark shows high latency or low IOPS, consider moving etcd to faster, dedicated SSD storage. This simple check often saves hours of troubleshooting when pods keep crashing for no obvious reason.
Back to the Demo
Once the cluster was stable, the actual demo came together quickly. The MLSysOps policy layer does what it’s supposed to do, telemetry shows the Raspberry Pi falling behind on frame rate, the policy fires, the vAccel backend switches to the Jetson AGX Orin, and object detection snaps to real‑time. The network hop is still present, but the GPU makes it irrelevant.
It’s a compelling demonstration of what adaptive, policy‑driven orchestration can achieve in a heterogeneous edge environment. We only had to fight through a disk‑I/O problem to get there.
Sometimes the most useful debugging sessions are the ones where the answer turns out to be completely orthogonal to where you were looking. etcd taught us that distributed systems have strong opinions about their infrastructure—it’s worth listening to them.