The Svelte Compiler Got 55% Faster. The Fix Was 3 Files.
Source: Dev.to


A developer from Oslo opened a GitHub issue three days before this PR. His question was simple:
“What’s Svelte’s roadmap on improving tool performance?”
Rich Harris’s answer was shorter: no formal roadmap. Profile it. Fix what you find.
So Mathias Picker did exactly that. He profiled the Svelte compiler, found two algorithmic problems hiding at the intersection of two subsystems, and opened a pull request that touched three code files.
Rich Harris’s review: “fantastic!”
The PR shipped the same day. Svelte’s compiler analysis phase got 20 %–55 % faster. But here’s what the diff didn’t show: one of those files—state.js—is the shared global state imported by 30 files across all three compiler phases. Change it, and 2,036 downstream files are in the blast radius.
GitHub said: 4 files changed.
The dependency graph said: 2,036.
The PR
sveltejs/svelte#17823 — “perf: optimize compiler analysis phase”
Svelte’s compiler works in three phases:
- Parse – text → AST
- Analyze – extract meaning (scoping, reactivity, CSS pruning)
- Transform – generate JavaScript
The analysis phase is where the compiler figures out scoping, reactivity, and CSS pruning—the work that makes Svelte feel like magic.
Two problems were hiding inside it.
Problem 1: CSS pruning walked the stylesheet once per element
The compiler needs to determine which CSS rules actually apply to which elements—unused rules get pruned. The old code looped over every element and, for each one, walked the entire CSS AST:
// Before: O(n × m) — n elements, m CSS rules
for (const node of analysis.elements) {
  prune(analysis.css.ast, node); // walks entire stylesheet each time
}
With 50 elements and 100 CSS rules, that’s 50 full tree walks over the stylesheet AST.
Fix: Invert the loop—walk the stylesheet once and match elements inside each selector.
// After: one walk, elements matched inside
prune(analysis.css.ast, analysis.elements);
Problem 2: Deep‑cloning a stack on every AST node
Svelte supports “ comments that suppress warnings. The compiler tracks these in a stack. The old code called structuredClone(ignore_stack) on every single AST node, even though ignore comments appear only 0–5 times per component:
// Before: deep‑clone on every AST node visit
ignore_map.set(node, structuredClone(ignore_stack));
A typical component has 500–2,000 AST nodes. That’s 500–2,000 deep clones of an array that almost never changes.
Fix: Cache the snapshot and only rebuild it when push_ignore or pop_ignore actually changes the stack.
export function get_ignore_snapshot() {
  if (cached_ignore_snapshot === null) {
    cached_ignore_snapshot = ignore_stack.map((s) => new Set(s));
  }
  return cached_ignore_snapshot;
}
Results (500 compilations later)
| Component | Before | After | Speed‑up |
|---|---|---|---|
| 80+ selectors, 12 elements | 3.405 ms | 2.680 ms | 21 % |
Nested each blocks | 2.034 ms | 1.575 ms | 23 % |
| 100 rules, 50 elements | 10.099 ms | 4.564 ms | 55 % |
Three files. Two fixes. A noticeable performance win.
What the dependency graph shows
The GitHub diff hides where these three files sit in Svelte’s architecture (the fourth changed file is a .changeset metadata entry—no code).

File locations
| File | Location | Role | Import impact |
|---|---|---|---|
state.js | packages/svelte/src/compiler/state.js | Shared global state (warnings, filename, source, ignore stack) | Imported by 30 files across all three phases |
index.js | packages/svelte/src/compiler/phases/2-analyze/index.js | Analysis‑phase entry point | Orchestrates the analysis walk for every component |
css-prune.js | packages/svelte/src/compiler/phases/2-analyze/css/css-prune.js | Performs CSS dead‑code elimination | Determines which CSS rules apply to which elements |
When you select state.js in the 3‑D graph and expand its blast radius, the ripple is immediate: 30 direct importers across all three phases, those feed into phase entry points, those feed into the compiler root, and the compiler root feeds into every test harness. By the time the ripple stops, 2,036 of 3,301 files are lit up—62 % of the entire Svelte codebase, all from a change to three files.
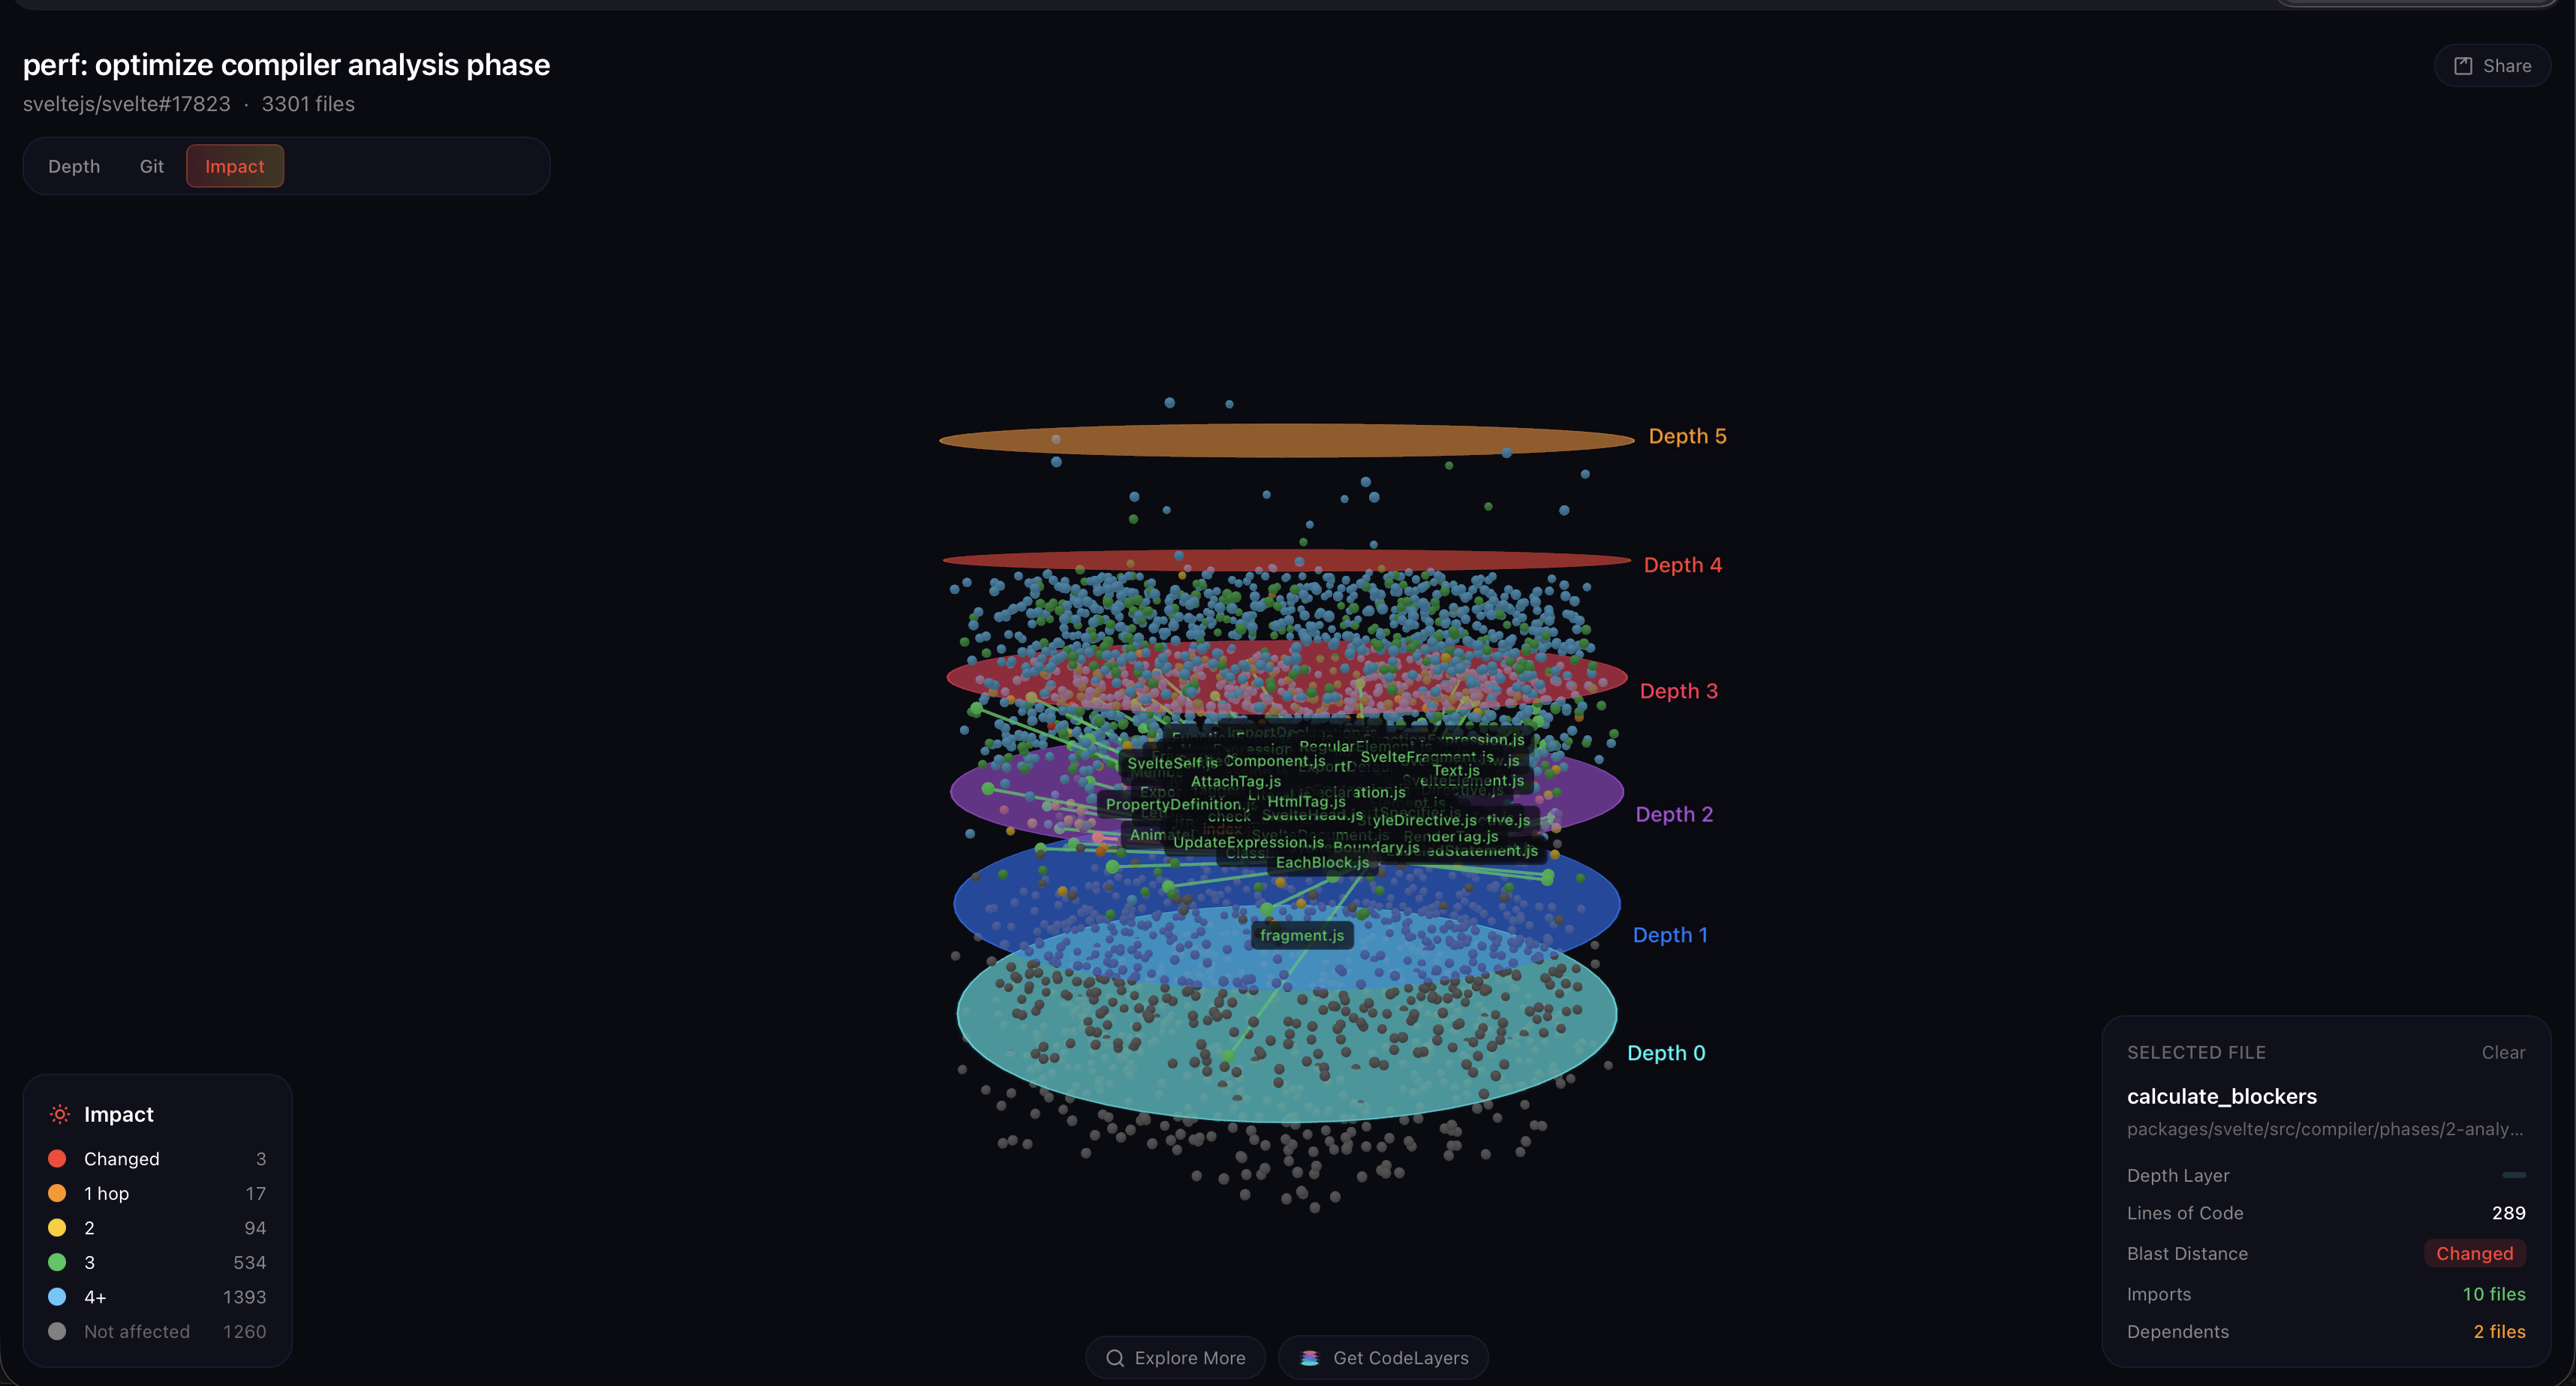
This is the insight a flat diff view can’t give you. `state.js` is the most connected file Mathias touched — it’s not in the analysis phase at all, it’s *below* it, shared by everything. That’s why these optimizations matter so much: the code paths he fixed run on **every AST node of every component**, inside a module that the entire compiler depends on. A 3‑file fix with a 2,000‑file blast radius — because the files are load‑bearing.The bigger story
Mathias didn’t stop at one PR. Over eight days he opened five performance pull requests:
| PR | What it fixed | Speed‑up | Explore |
|---|---|---|---|
| #17811 | Parser hot paths | 18 % faster | View in 3D |
| #17823 | Analysis phase (this PR) | 21‑55 % faster | View in 3D |
| #17839 | Element interactivity caching | ~8 % faster | — |
| #17844 | O(n²) scope‑name scanning | ~10 % faster | View in 3D |
| #17846 | CSS selector pruning | ~16 % faster | View in 3D |
All merged by Rich Harris and shipped within days.
It started with one question: “What’s Svelte’s roadmap on improving tool performance?”
The answer turned out to be: one developer with a profiler, eight days, and five pull requests.
See it yourself
We ran this PR through CodeLayers Explore – paste any GitHub PR URL and get an interactive 3‑D dependency graph. Here’s sveltejs/svelte#17823:
- Click any node.
- Rotate the graph.
- Select a changed file and watch the blast radius expand through the depth rings.
- See where the analysis phase sits relative to the parser and transformer.
Want this visibility on your own PRs?
- VS Code extension – shows blast radius inline as you code (tree view, gutter decorations, CodeLens annotations across 11 languages). Runs locally; nothing leaves your machine.
- GitHub Action – auto‑posts a 3‑D visualization link on every PR. Two‑minute setup; reviewers instantly see what a diff can’t show.
This is Blast Radius #1 – a weekly series where we run real open‑source PRs through a 3‑D dependency graph and show what the diff missed. Got a PR you want us to visualize? Find us on Bluesky.