Supabase with PowerBI Dashboard
Published: (December 11, 2025 at 09:54 AM EST)
2 min read
Source: Dev.to
Source: Dev.to
Real-Time Sales & Inventory Dashboard
A full‑stack Business Intelligence demo integrating Supabase (PostgreSQL) as the cloud backend and Microsoft Power BI for frontend data visualization. This project demonstrates how to track sales revenue and monitor inventory levels in real‑time.
Project Overview
- Backend: Supabase (PostgreSQL) hosted on AWS.
- Frontend: Microsoft Power BI Desktop.
- Goal: Visualize sales trends, category performance, and low‑stock alerts using cloud data.
Tech Stack
- Supabase – Open‑source Firebase alternative (PostgreSQL database).
- Power BI Desktop – Data visualization tool.
Setup Instructions
Part 1: Supabase Setup (Backend)
- Create a new project on Supabase.
- Navigate to the SQL Editor in the left sidebar.
- Run the following SQL script to create the schema and seed dummy data:
-- 1. Create Tables
CREATE TABLE public.products (
    id SERIAL PRIMARY KEY,
    name TEXT NOT NULL,
    category TEXT NOT NULL,
    unit_price DECIMAL(10, 2) NOT NULL,
    stock_quantity INT NOT NULL,
    created_at TIMESTAMP WITH TIME ZONE DEFAULT NOW()
);

CREATE TABLE public.orders (
    id SERIAL PRIMARY KEY,
    product_id INT REFERENCES public.products(id),
    quantity INT NOT NULL,
    total_amount DECIMAL(10, 2) NOT NULL,
    order_date DATE NOT NULL DEFAULT CURRENT_DATE
);

-- 2. Insert Dummy Data
INSERT INTO public.products (name, category, unit_price, stock_quantity)
VALUES
    ('Wireless Mouse', 'Electronics', 25.50, 150),
    ('Mechanical Keyboard', 'Electronics', 85.00, 40),
    ('Gaming Monitor', 'Electronics', 300.00, 15),
    ('Ergonomic Chair', 'Furniture', 150.00, 10),
    ('Desk Lamp', 'Furniture', 45.00, 80),
    ('USB‑C Cable', 'Accessories', 12.00, 200);

INSERT INTO public.orders (product_id, quantity, total_amount, order_date)
VALUES
    (1, 2, 51.00, CURRENT_DATE - INTERVAL '3 days'),
    (2, 1, 85.00, CURRENT_DATE - INTERVAL '3 days'),
    (1, 1, 25.50, CURRENT_DATE - INTERVAL '2 days'),
    (3, 1, 300.00, CURRENT_DATE - INTERVAL '2 days'),
    (5, 4, 180.00, CURRENT_DATE - INTERVAL '1 day'),
    (4, 1, 150.00, CURRENT_DATE),
    (6, 10, 120.00, CURRENT_DATE);
Part 2: Power BI Connection (Frontend)
-
Enable connection pooling in Supabase:
- Go to Project Settings → Database.
- Turn on Use connection pooling and set Mode to Session.
- Copy the Pooler Host (e.g.,
aws-0-us-east-1.pooler.supabase.com) and the database user.
-
Connect in Power BI:
- Get Data → PostgreSQL database
- Server: paste the Pooler Host URL.
- Database:
postgres. - Data Connectivity Mode:
Import. - Authentication: Database (User/Password).
Dashboard Visuals
- KPI Card: Total Sales Revenue (sum of
total_amount). - Pie Chart: Sales distribution by Category (Electronics vs. Furniture).
- Table: Low‑Stock Alerts (items with
stock_quantity< 20).
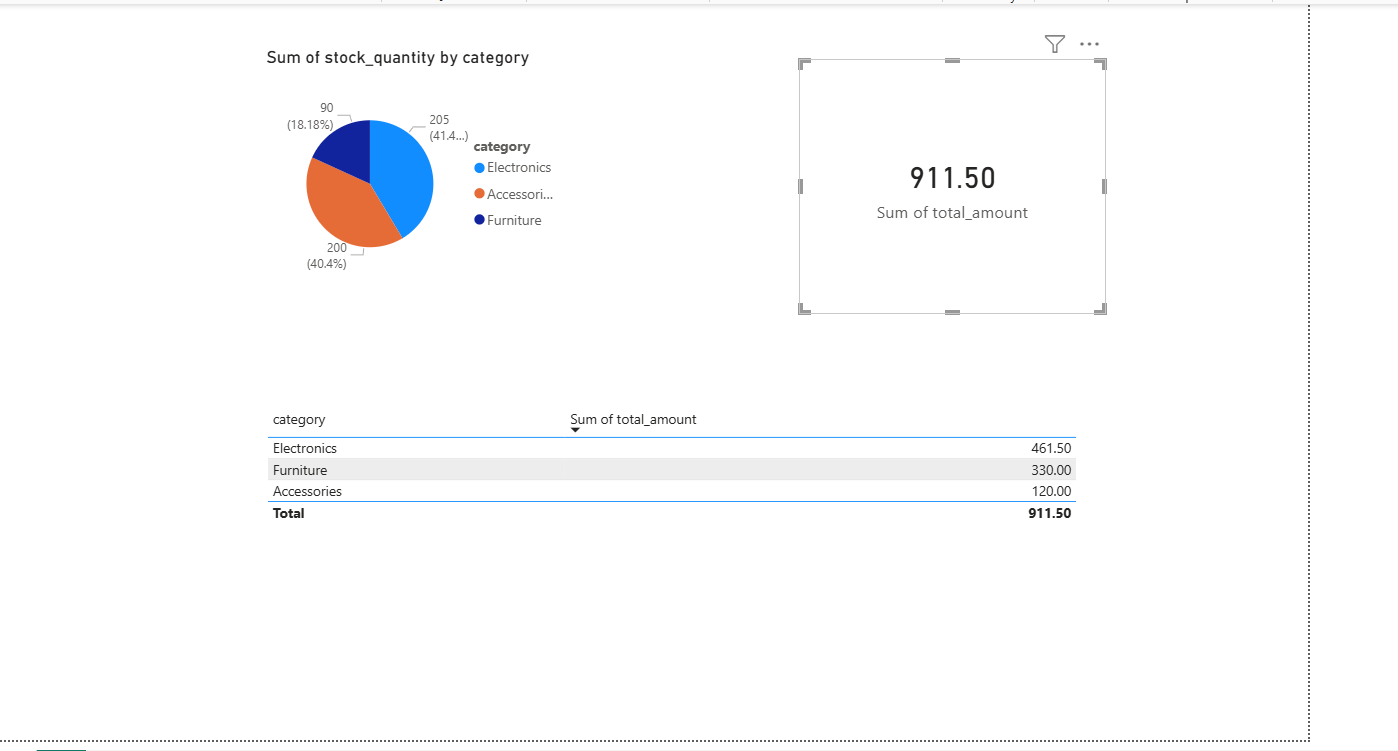
Initial dashboard view.
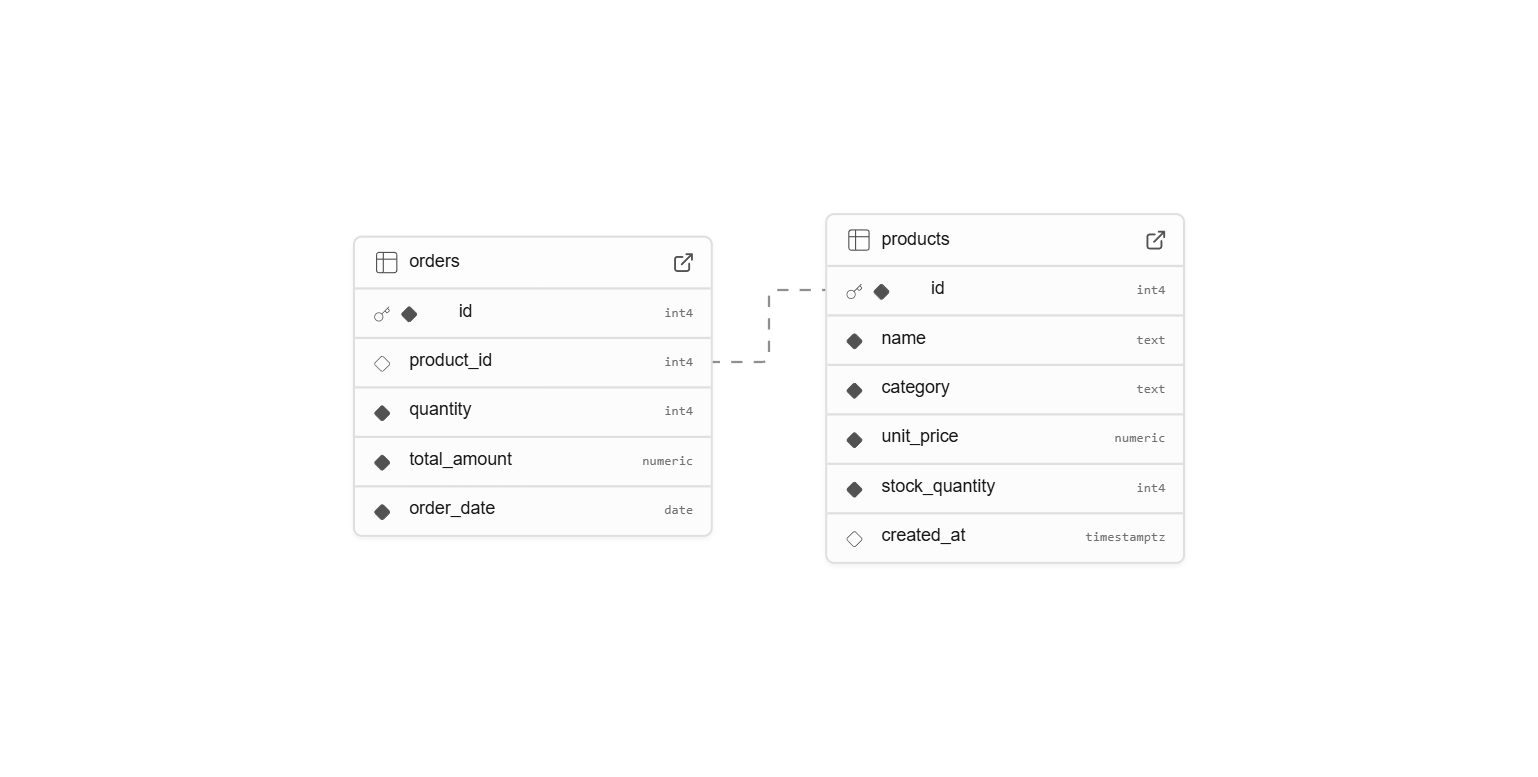
Database schema diagram.
Troubleshooting
“The remote certificate is invalid”
Supabase uses SSL, and Power BI may reject the certificate by default.
Fix:
File → Options and settings → Data source settings → select the source → Edit Permissions → uncheck Encrypt connections.
“Host not found”
Ensure you are using the Pooler URL (port 5432 or 6543) from Supabase Database settings, not the direct connection string.