Schemas and Data Modelling in Power B.I
Source: Dev.to
Data modeling is the architectural backbone of every successful Power BI solution. Whether building an executive dashboard or a complex analytics engine, the structural integrity of the data determines performance, flexibility, and reporting accuracy.
Schemas fall into two primary categories—Star and Snowflake—following general practices of dimensional modeling used widely in analytics and BI. Each defines a different way to model facts and dimensions, balancing simplicity, performance, storage efficiency, and modeling flexibility. The Star Schema is usually the recommended approach because it prioritizes read performance over write efficiency.
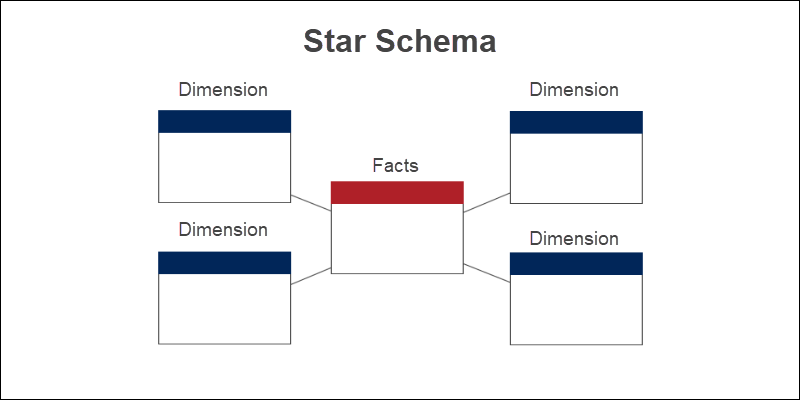
Star Schema
The star schema involves structuring your data into multiple tables:
- Fact tables contain quantitative attributes that you want to measure.
- Dimension tables contain descriptive attributes that group and categorize data from fact tables.
Fact tables
A fact table records events (transactions). Duplicates are normal because the same type of event can occur many times, and the table changes/updates often compared to dimensions.
-- Example fact table
FactTable_Visits (
    VisitID,
    PatientID,
    DoctorID,
    FacilityID,
    DateID,
    VisitCost,
    LengthOfStay
)
Dimension tables
A dimension table holds information about categorical fields in the fact table and is typically smaller than the fact table.
-- Example dimension tables
Dimension_Patient (PatientID, FullName, …)
Dimension_Doctor   (DoctorID,   FullName, …)
Dimension_Facility (FacilityID, Name,     …)
Dimension_Date     (DateID,     Date,     …)
Relationships and cardinality
In Power BI, relationships are built by matching one column from one table to one column in another table, linking each dimension key to the corresponding key in the fact table, e.g.:
Patient[PatientID]   → FactVisits[PatientID]
Doctor[DoctorID]     → FactVisits[DoctorID]
Facility[FacilityID] → FactVisits[FacilityID]
Date[DateID]         → FactVisits[DateID]
If uniqueness is defined by a combination of fields (e.g., PatientID + DateID), create a combined key:
PatientDateKey = PatientID & "-" & DateIDand relate tables using that single column.
Cardinality describes how many rows in one table can match rows in another: one‑to‑one, one‑to‑many, many‑to‑one, or many‑to‑many. When a many‑to‑many relationship is unavoidable, use a bridge table (associative entity) to convert it into two one‑to‑many relationships.
Snowflake Schema
A snowflake schema normalizes dimension tables into multiple related tables. Instead of keeping everything in one large dimension table (as in a star schema), descriptive data is split into smaller tables to reduce duplication. It’s called “snowflake” because dimensions branch out into sub‑dimensions, creating a layered structure.
Structure
- Fact Table: Stores measurable event/transaction data (numeric values) at a specific grain.
- Dimension Tables: Split into multiple connected tables to represent hierarchies.
Example (healthcare):
- Patient → Ward → Department → Hospital
- Doctor → Specialty → Department
Fact Table: Visits
| Column | Description |
|---|---|
| VisitID | Unique identifier for the visit |
| PatientID | Foreign key to Patient |
| DoctorID | Foreign key to Doctor |
| WardID | Foreign key to Ward |
| DateID | Foreign key to Date |
| VisitCost | Cost of the visit |
| LengthOfStay | Duration of the visit |
Dimension tables (normalized)
Patient   (PatientID, FullName, WardID)
Ward      (WardID, WardName, DepartmentID)
Department(DepartmentID, DepartmentName, HospitalID)
Hospital  (HospitalID, HospitalName)

Doctor    (DoctorID, FullName, SpecialtyID)
Specialty (SpecialtyID, SpecialtyName, DepartmentID)
Relationships
Relationships remain primarily one‑to‑many, but dimensions connect through multiple levels (e.g., Patient → Ward → Department → Hospital). Consequently, filter paths are longer than in a star schema.
Good data modelling is critical because it directly dictates the efficiency, accuracy, and usability of your reports. A well‑structured model with clear relationships and reduced redundancy improves query performance, allowing dashboards to load faster even as data scales. Enforcing data‑integrity constraints and defining logical connections between entities ensures that calculations, filters, and aggregations remain accurate across the entire system, preventing errors that could lead to misleading insights.