React Native + Sentry: Smarter Crash Reporting & Debugging
Source: Dev.to
The Problem
Even after thorough testing (unit tests, UAT, etc.), some issues only appear in production.
When users report them, the information is usually vague:
- No exact error message
- No stack trace
- No device details
- No steps to reproduce
This makes debugging slow, frustrating, and often a guessing game.
It’s also hard to prioritize fixes when you don’t know how many users are affected.
Sentry fills this gap by giving you real‑time visibility into what’s happening inside your app.
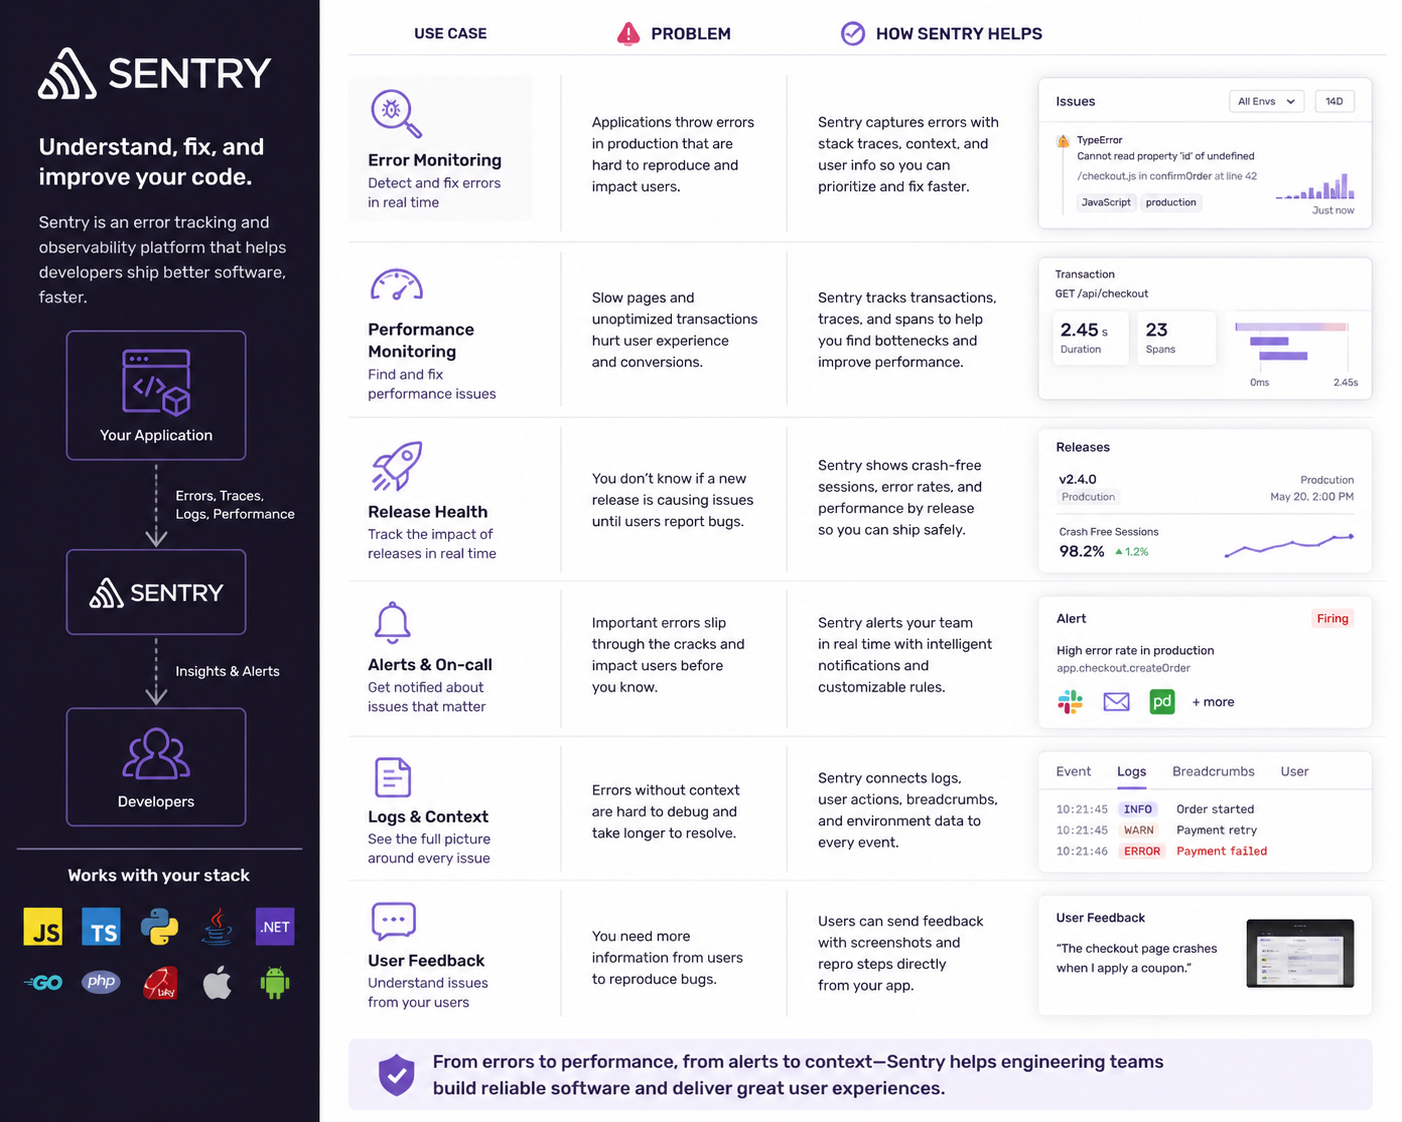
What Is Sentry?
Sentry is a real‑time error‑monitoring and performance‑tracking platform.
Instead of guessing what went wrong in production, you get:
| Feature | What You See |
|---|---|
| Exact error message | “Cannot read property ‘map’ of undefined”, “Network request failed”, … |
| Stack trace | The exact file and line where the error occurred, helping you answer: • Which screen crashed? • Which function triggered it? • Which file needs fixing? |
| User & device context | Device model, OS version, app version, user ID (if tracked) |
| Breadcrumbs | A timeline of actions leading up to the crash (e.g., User opened Home Screen → Clicked “Buy Now” → API request failed → App crashed) |
Setup & Integration
Below is a step‑by‑step guide to add Sentry to a React Native project.
Step 1 – Install the SDK
# Using Yarn
yarn add @sentry/react-native

# Or using npm
npm install @sentry/react-native
Step 2 – Run the Sentry Wizard
The wizard links Sentry with your native projects and asks for your DSN.
npx @sentry/wizard -i reactNative -p ios androidStep 3 – Initialise Sentry in Your Code
Create a file called sentrySetup.ts (or .js) at the project root:
// sentrySetup.ts
import * as Sentry from '@sentry/react-native';

Sentry.init({
  dsn: 'YOUR_DSN_HERE',
  // Adjust the sample rate for production as needed
  tracesSampleRate: 1.0,
});
Replace YOUR_DSN_HERE with the DSN from your Sentry dashboard.
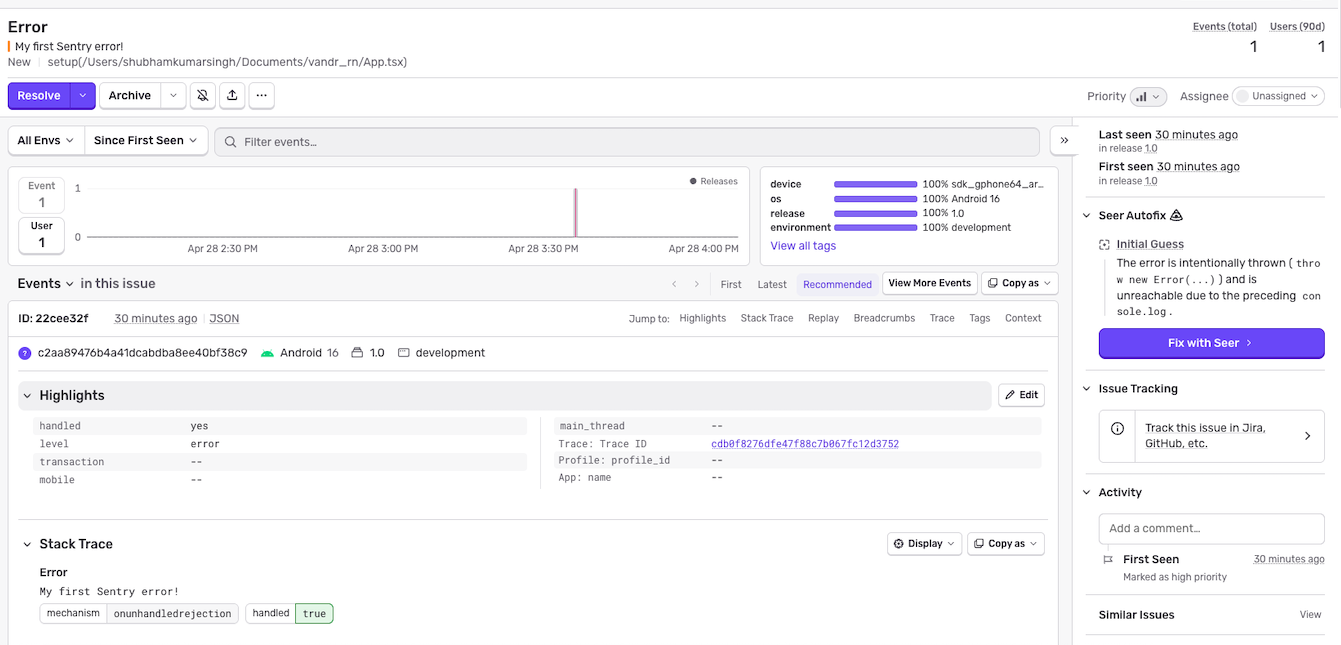
Import this file in the entry point of your app (usually App.tsx):
// App.tsx
import './sentrySetup';
import * as Sentry from '@sentry/react-native';
import RootNavigator from './src/navigation/RootNavigator';
import ErrorScreen from './src/screens/ErrorScreen';

function App() {
  return (
    }>


  );
}

// Wrap the component so Sentry can capture unhandled errors
export default Sentry.wrap(App);
What This Does
- Global error tracking
- Performance monitoring (if you enable it)
- Automatic crash reporting
- Graceful UI fallback via
ErrorBoundary
Step 4 – (Optional) Add a Custom Error Boundary
If you prefer a custom UI for crashes, you can wrap any part of the tree:
import * as Sentry from '@sentry/react-native';
import CustomFallback from './components/CustomFallback';

function SomeScreen() {
  return (
    }>
      {/* Your screen UI */}

  );
}
The Sentry Dashboard
The dashboard gives you a centralized view of all errors, with filters for:
- Release version
- Device/OS
- User impact (number of affected users)
- Frequency & severity
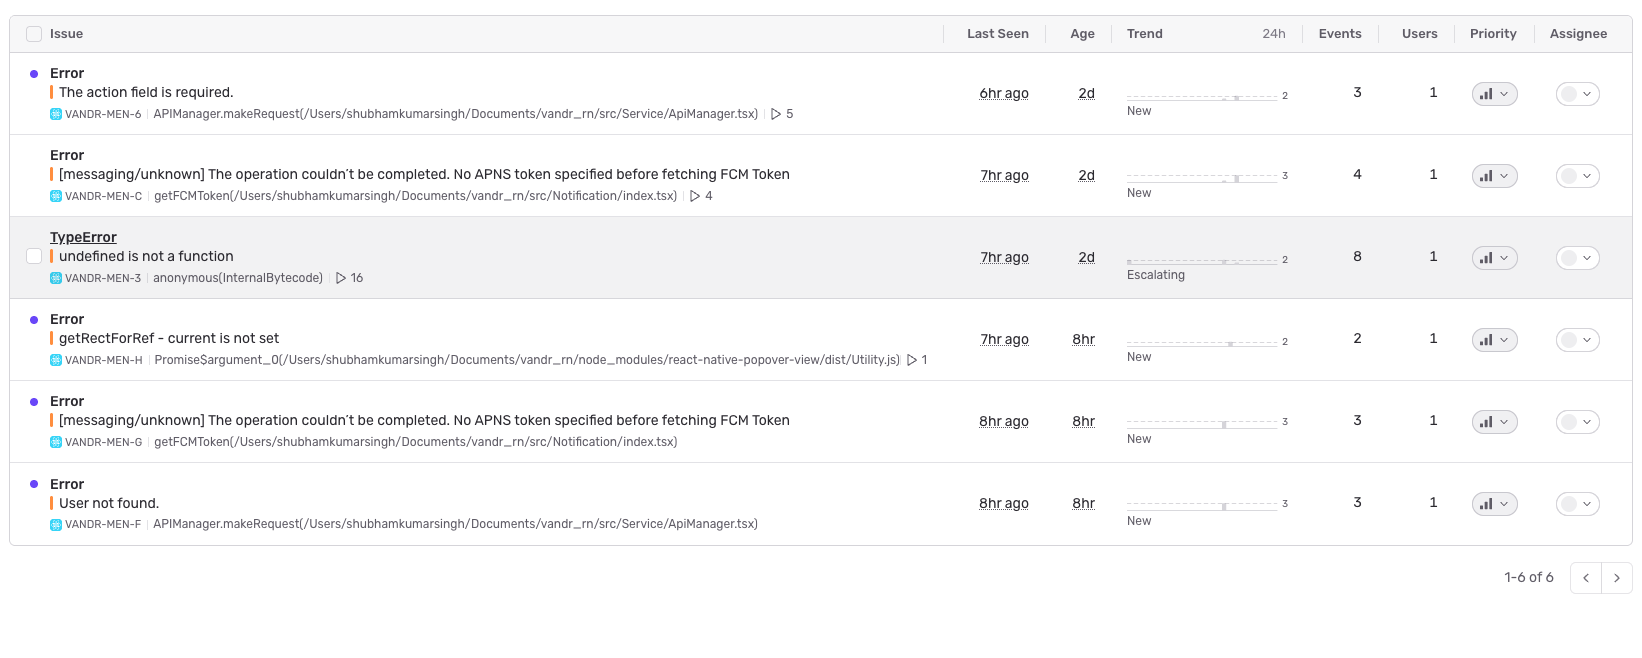
From here you can:
- Prioritise issues based on user impact.
- Investigate stack traces and breadcrumbs.
- Assign tickets to team members.
- Track resolution progress over time.
TL;DR
Production crashes are inevitable, but you don’t have to debug them blind.
Sentry provides exact errors, stack traces, device context, and breadcrumbs in real time, letting you fix problems faster and ship more stable React Native apps.
Give it a try – the setup is only a few commands away!

Conclusion
Integrating Sentry into your React Native app can make a big difference, especially in production. It helps you track errors and crashes in real time, so you’re not left guessing what went wrong for your users. Instead of relying on user complaints or vague logs, you get detailed insights—like stack traces, device info, and user actions—that make debugging much easier.
If you care about delivering a smooth, reliable experience to your users while keeping your development workflow efficient, integrating Sentry is absolutely worth it.