Part 8: Databricks Pipeline & Dashboard
Source: Dev.to
Pipeline creation
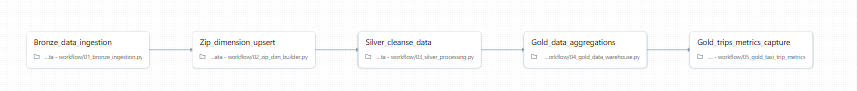
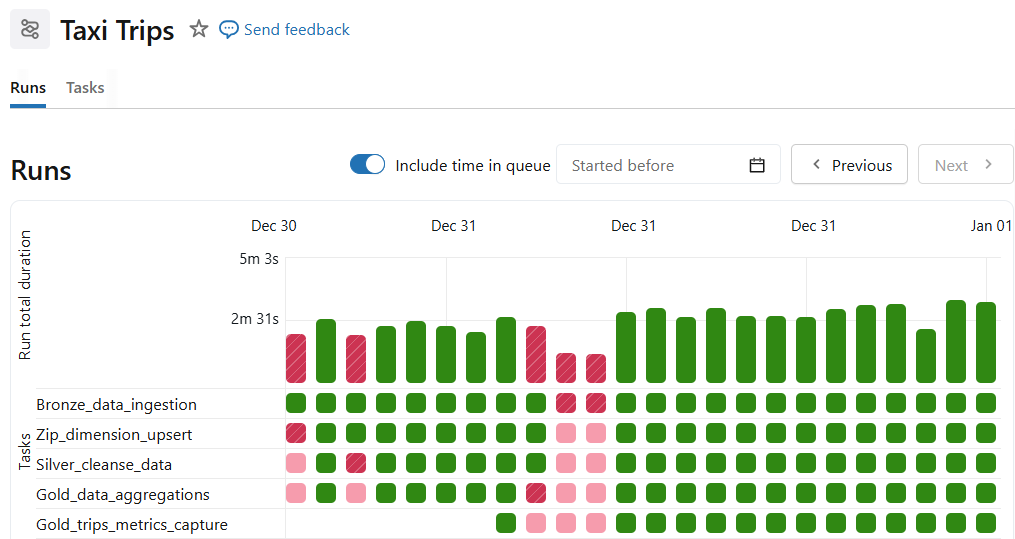
Databricks workflow is created with each task handling a part discussed in this blog series. The entire pipeline is orchestrated to stream and process data incrementally.
- Bronze ingestion
- ZIP dimension build
- Silver enrichment
- Gold aggregation (both tables)
Dependencies enforce order automatically. You can also schedule the pipeline with simple cron expressions.
Dashboard creation
Queries on the Gold tables feed data to Databricks dashboards. In the Databricks workflow, create your own dashboard and add custom queries to provide visual representations of business insights.
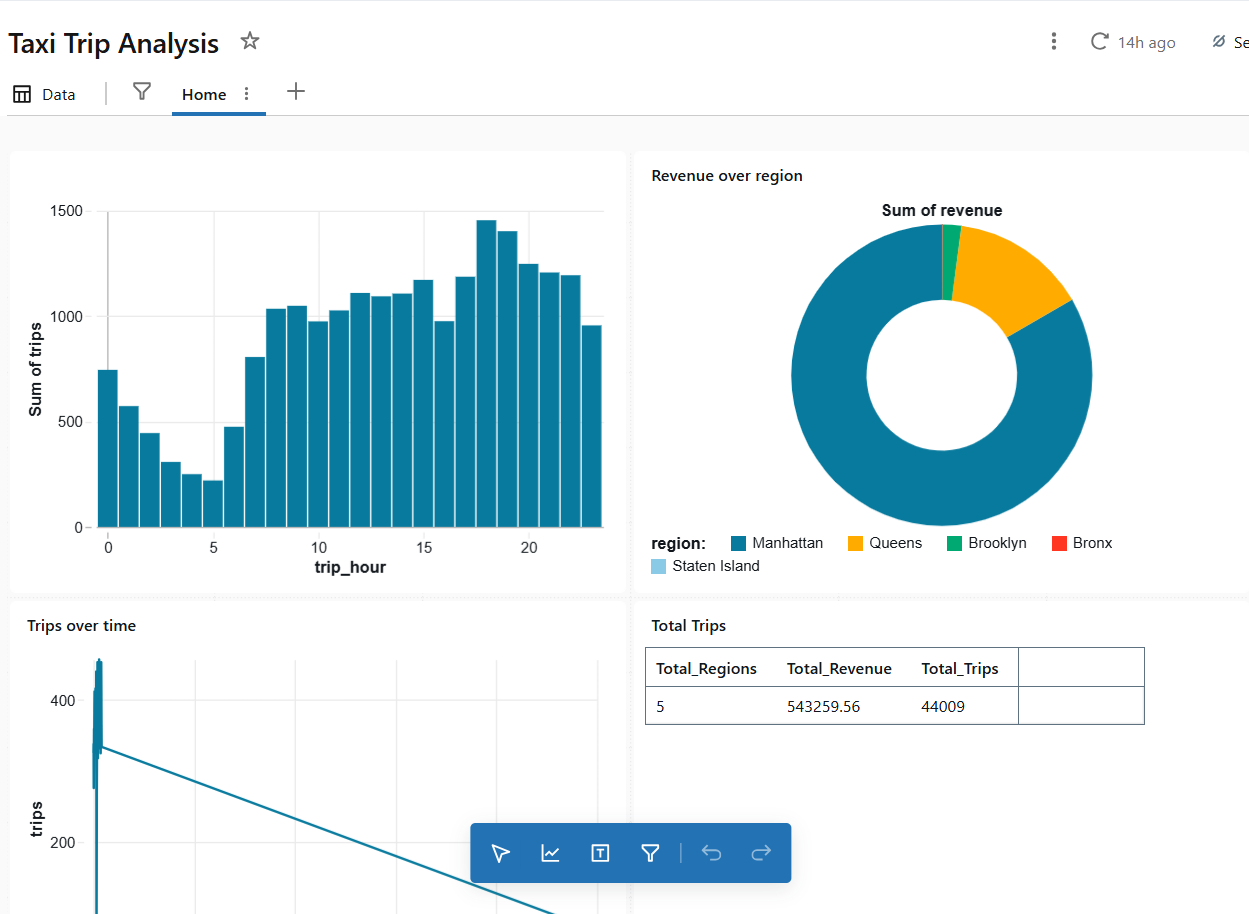
Example query
To get the peak hours, add the following query as a data source (SQL) and create a tile in the dashboard:
SELECT
  trip_hour,
  SUM(total_trips) AS trips
FROM nyc_taxi.gold.taxi_trip_metrics
GROUP BY trip_hour;
The result appears as:
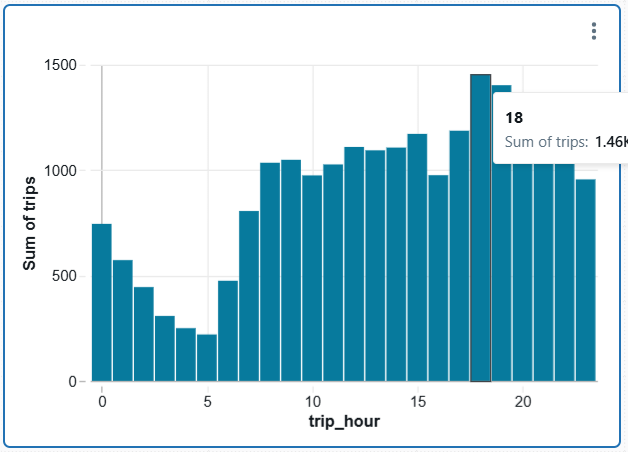
You can keep adding tiles to enrich your dashboard. Dashboards update automatically when:
- New files arrive
- Jobs rerun
- Late data is processed (within watermark)
To simulate new data arrival, add extra data to the DBFS input file source.
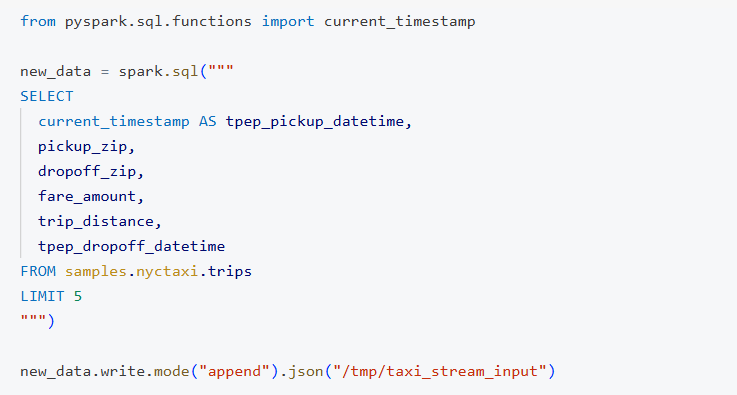
You can experiment with tpep_pickup_datetime to see watermarks handling late data in action.
Reprocessing strategy
If you need to reset the state and reprocess everything:
- Drop tables or schema.
- Delete checkpoints.
- Rerun the workflow.
The source code is available in the GitHub repository for reference.