Kiploks Robustness Score Kills Most Strategies (And That's the Point) Part 2
Source: Dev.to
Part 2 – Continuation of
Part 1 – Why 90 % of Trading Strategies Fail: A Deep Dive into Analytical Guardrails
In Part 1 we explored the theoretical “why” behind strategy failure.
In this post we get tactical – turning those analytical guardrails into concrete modules inside the Kiploks app.
These blocks sit between your raw back‑test and the “Deploy” button. Their job is to find reasons to reject your strategy before the market does.
The 5 Pillars of Robustness
We built five analysis blocks that transform a “too‑good‑to‑be‑true” back‑test into a realistic verdict:
| Pillar | Purpose |
|---|---|
| Benchmark Metrics | Out‑of‑Sample (OOS) reality check |
| Parameter Robustness & Governance | Sensitivity and “fragility” testing |
| Risk Metrics (OOS) | Measuring risk on unseen data |
| Final Verdict Summary | The definitive Go/No‑Go decision |
| Kiploks Robustness Score | One number (0 – 100) to rule them all |
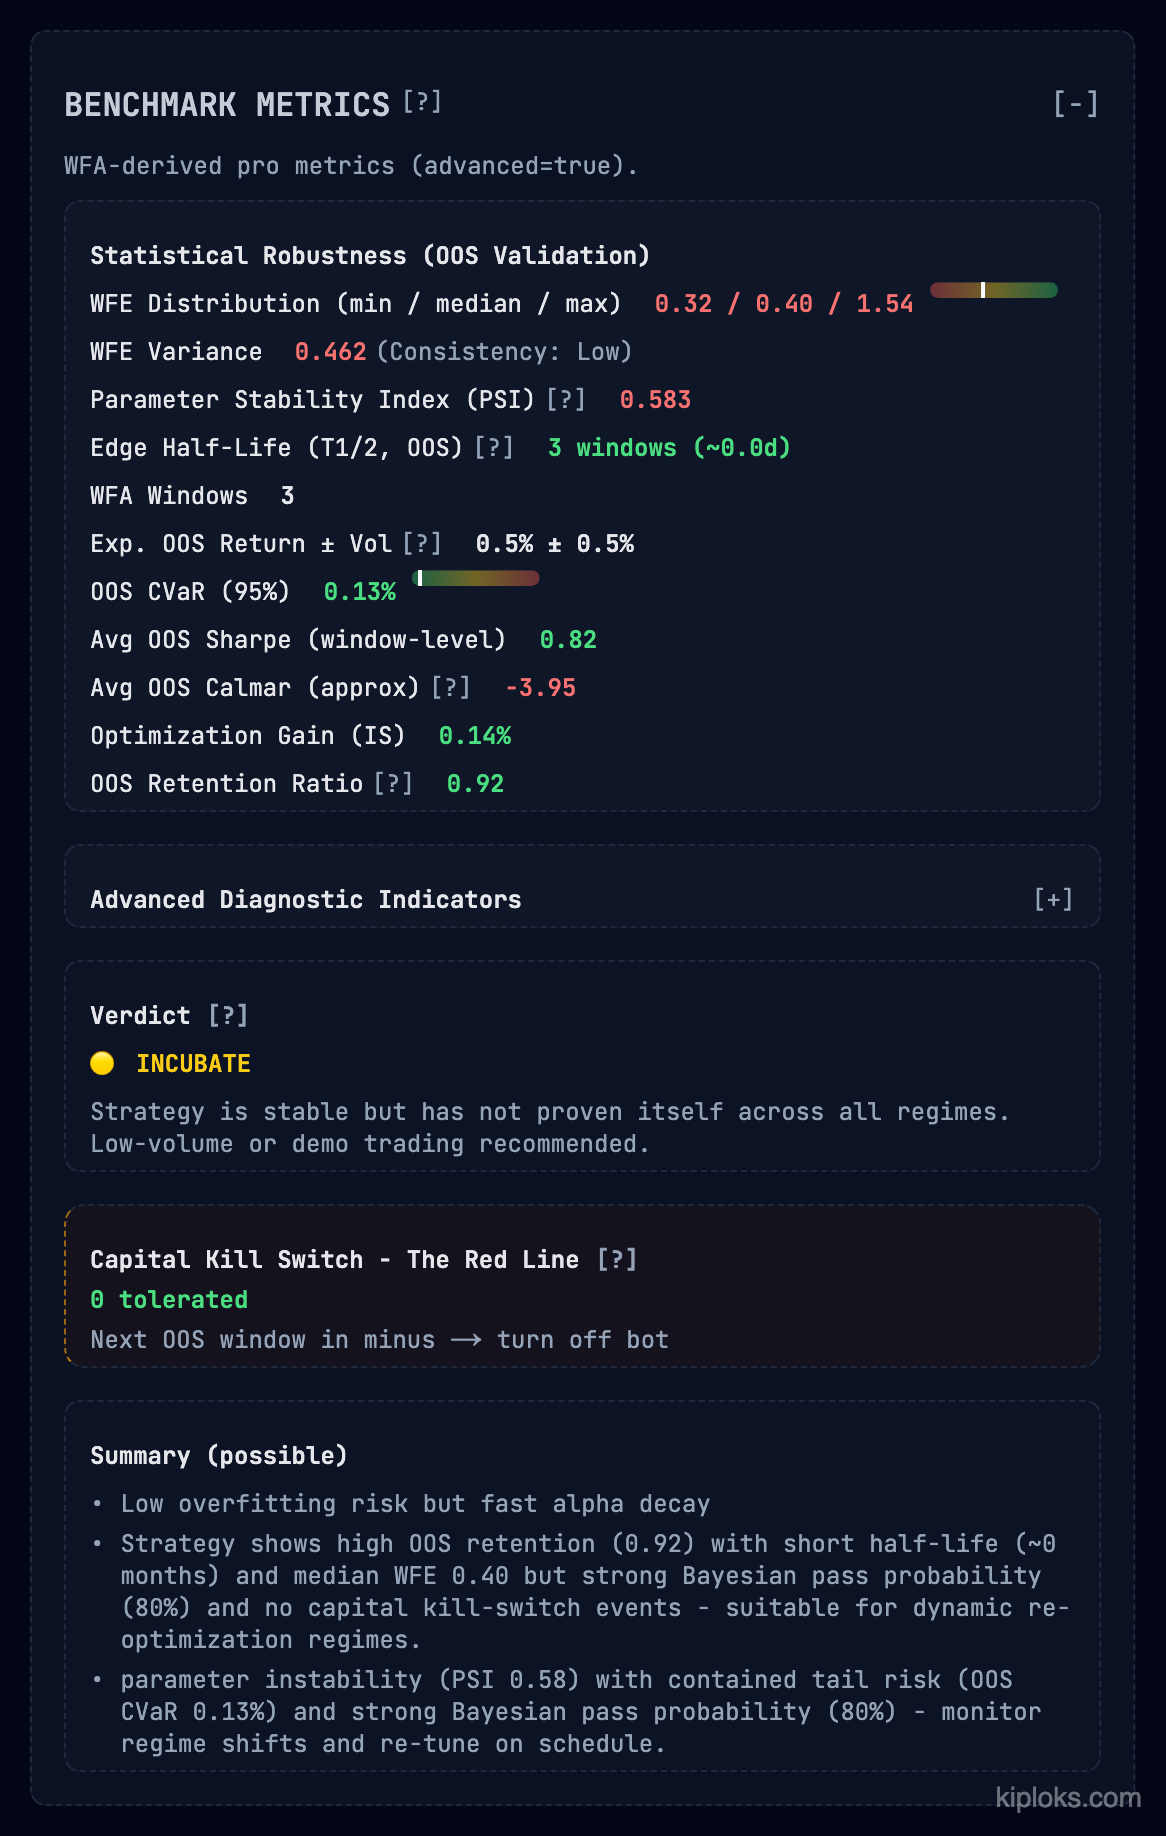
1. Benchmark Metrics – The OOS Reality Check
The Problem – Back‑tests are almost always over‑optimised. You need to see how much “edge” survives when the strategy hits data it wasn’t tuned for.
What we track
| Metric | Description |
|---|---|
| WFE Distribution | Minimum / median / maximum efficiency (e.g., 0.32 / 0.40 / 1.54) |
| Parameter Stability Index (PSI) | Measures if the logic holds as variables shift |
| Edge Half‑Life | How many windows until the alpha decays (e.g., 3 windows) |
| Capital Kill Switch | A hard “Red Line” rule – if the next OOS window is negative, the bot turns off automatically |
Verdict: INCUBATE – the strategy shows high OOS retention (0.92) but has a short alpha half‑life. It’s suitable for dynamic re‑optimisation, not for a “set‑and‑forget” deployment.
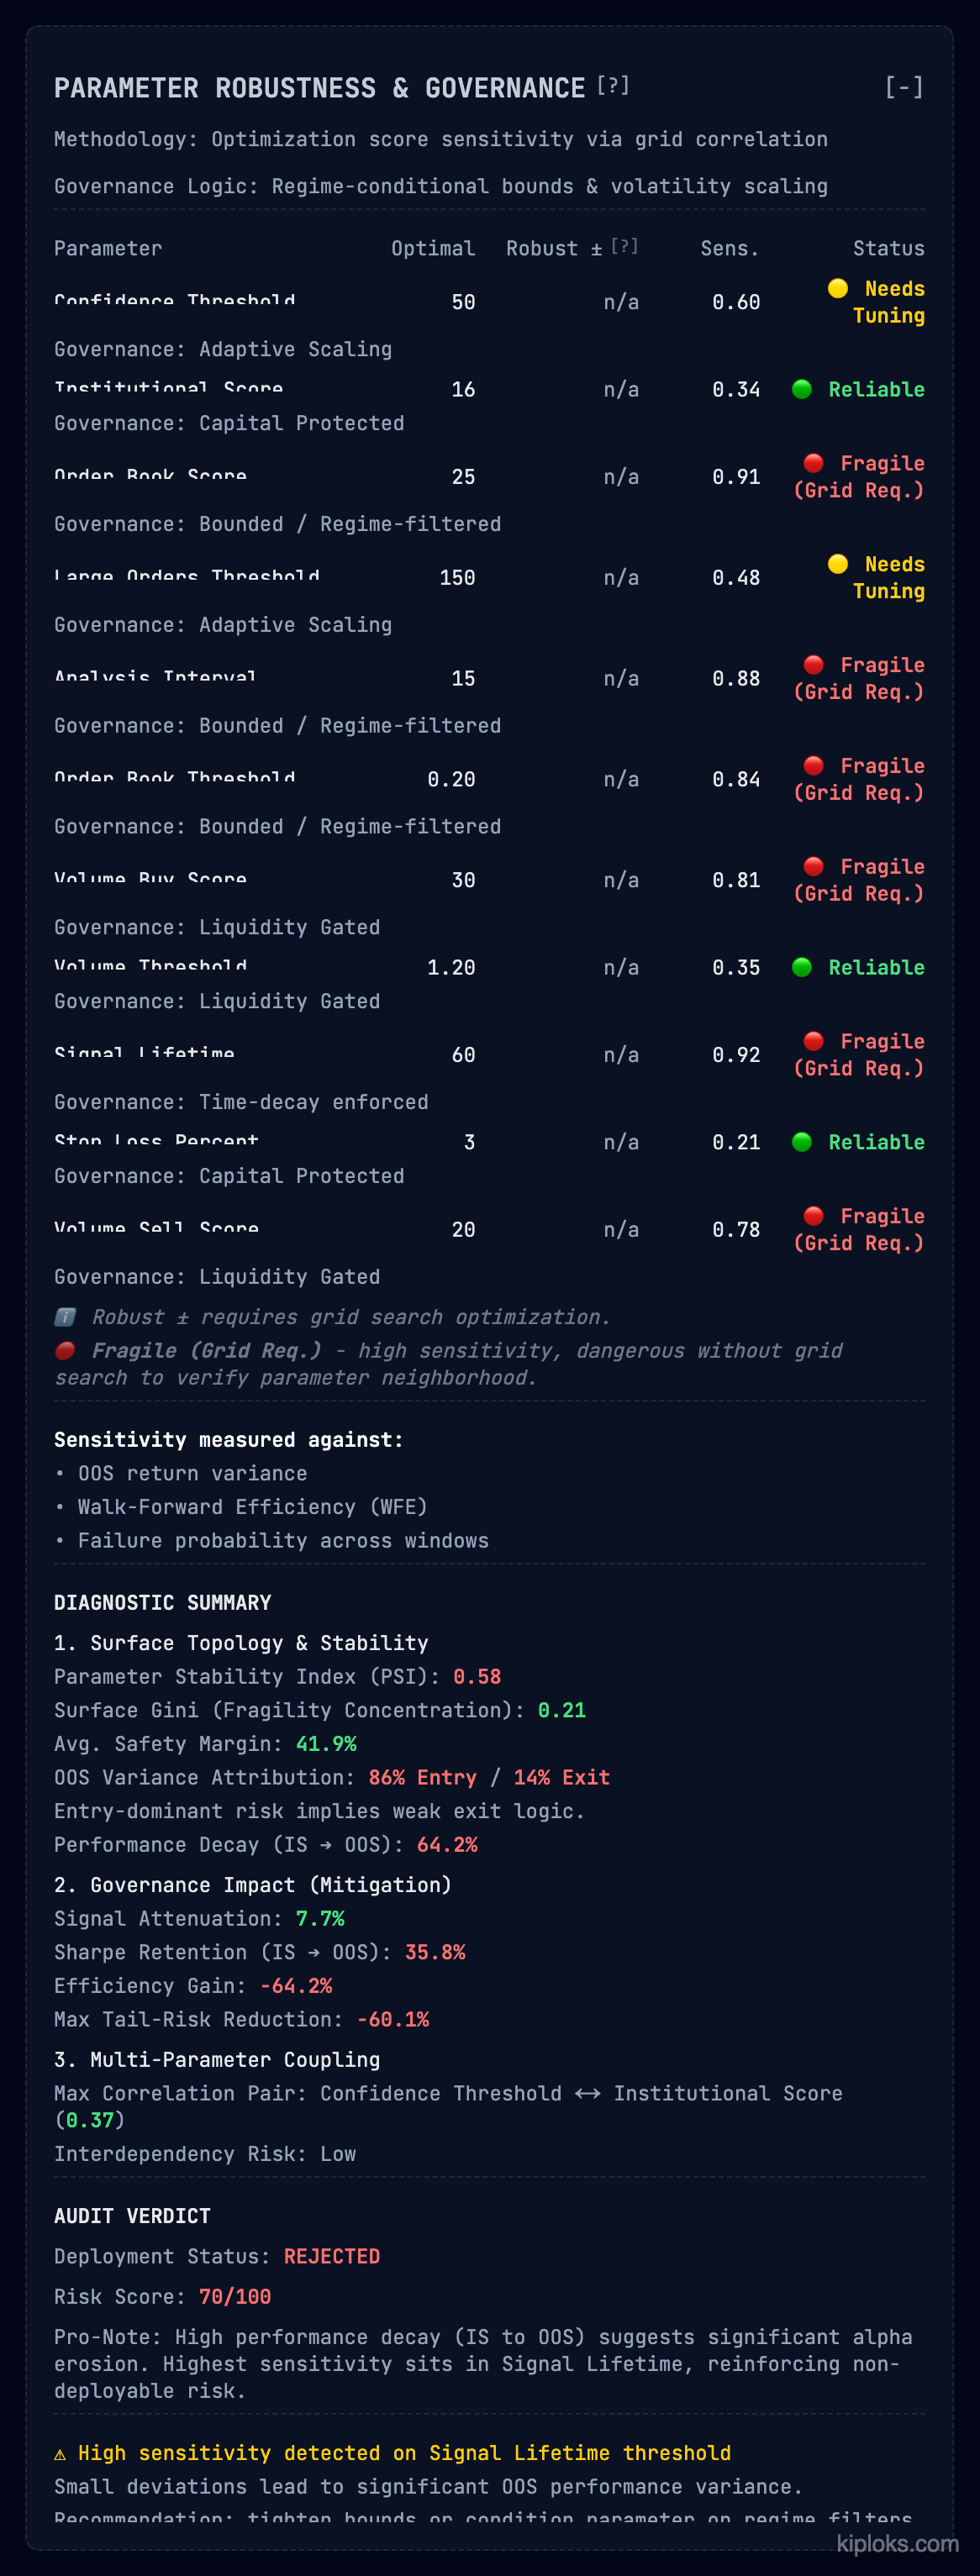
2. Parameter Robustness & Governance
The Problem – Many strategies are “glass cannons.” Tweak one parameter by a fraction and the edge disappears.
What we show
-
A granular breakdown of every parameter – from Signal Lifetime to Order Book Score – categorised by:
- Sensitivity – how dangerous a parameter is without a grid search (e.g.,
0.92is “Fragile”). - Governance – safety guardrails applied, such as “Liquidity Gated” or “Time‑decay enforced”.
- Sensitivity – how dangerous a parameter is without a grid search (e.g.,
-
The Audit Verdict provides a Surface Gini to show if fragility is concentrated in one spot. In our example a High Performance Decay (64.2 %) from in‑sample to OOS leads to a hard REJECTED status.
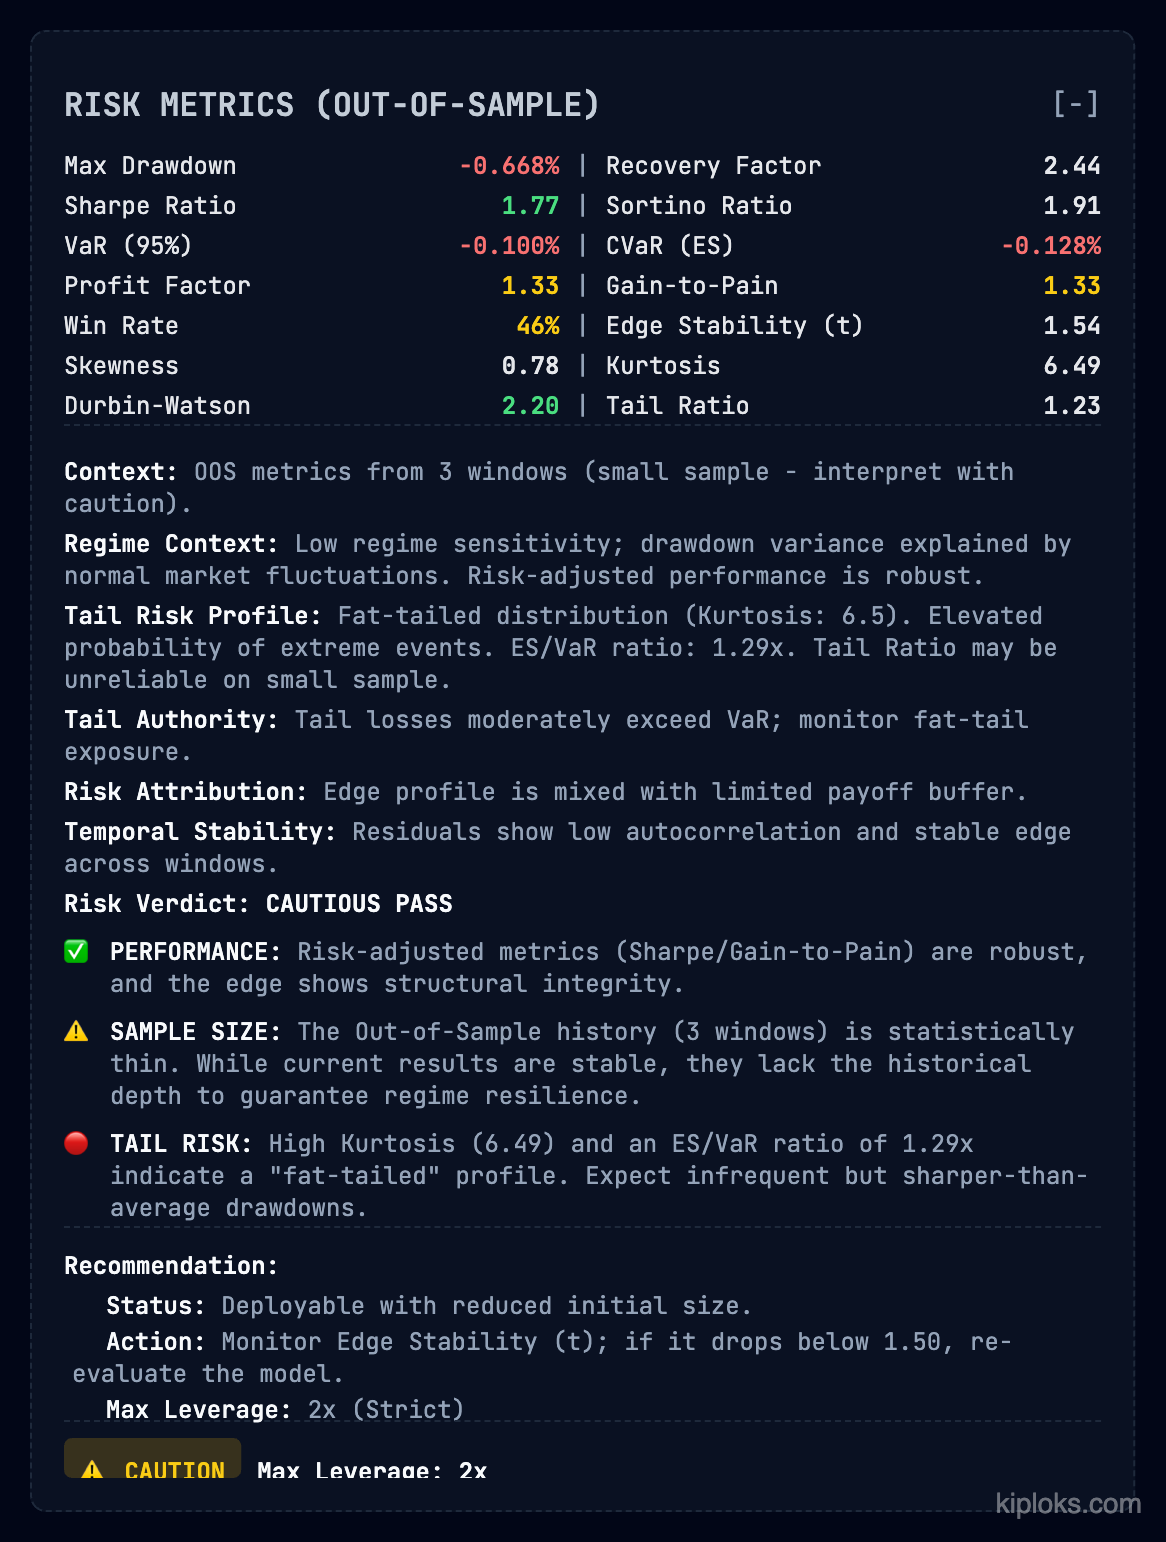
3. Risk Metrics (Out‑of‑Sample)
The Problem – Standard risk metrics (Sharpe, Drawdown) calculated on optimised data are lies. They represent the “best case,” not the “real case.”
The Solution – A dedicated risk block built strictly from OOS data.
| Metric | Value | Interpretation |
|---|---|---|
| Tail‑Risk Profile – Kurtosis | 6.49 | Indicates fat‑tail behaviour |
| ES/VaR Ratio | 1.29× | Highlights tail‑risk severity |
| Temporal Stability – Durbin‑Watson | (test result) | Checks for autocorrelation in residuals; a low value suggests the edge may be a lucky streak |
Recommendation – Deployable with a reduced initial size. Monitor Edge Stability; if it drops below 1.50, re‑evaluate.
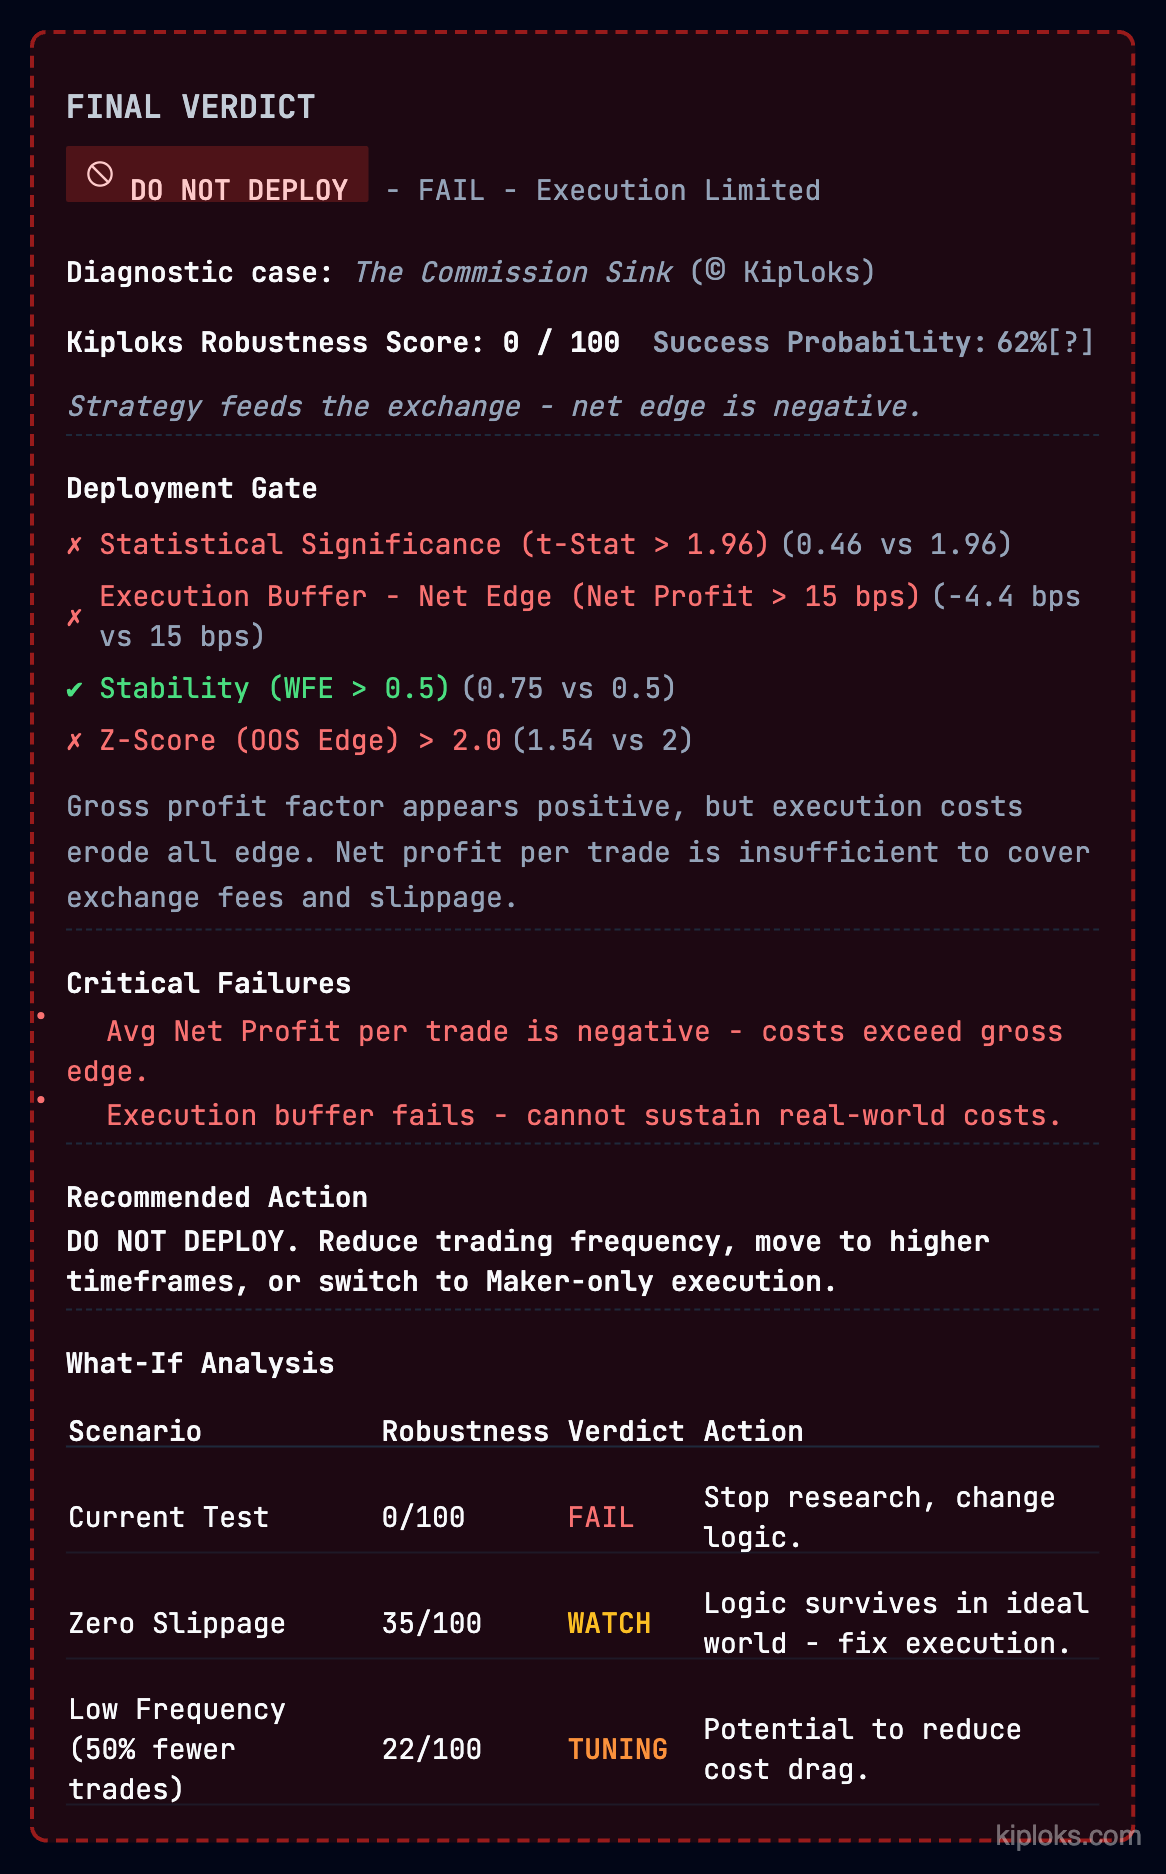
4. Final Verdict Summary – The Moment of Truth
The Problem – Quantitative reports are too dense. You need a clear answer: Launch, Wait, or Drop?
The Deployment Gate provides a binary checklist of what passed and what failed:
| Criterion | Measured | Required | Result |
|---|---|---|---|
| Statistical Significance | 0.46 | 1.96 | FAIL |
| Execution Buffer | ‑4.4 bps | 15 bps | FAIL |
| Stability (WFE) | 0.75 | 0.5 | PASS |
Even though the logic is stable, the Execution Buffer fails, so the overall verdict is FAIL — Execution Limited. The strategy simply “feeds the exchange” because costs erode all edge.
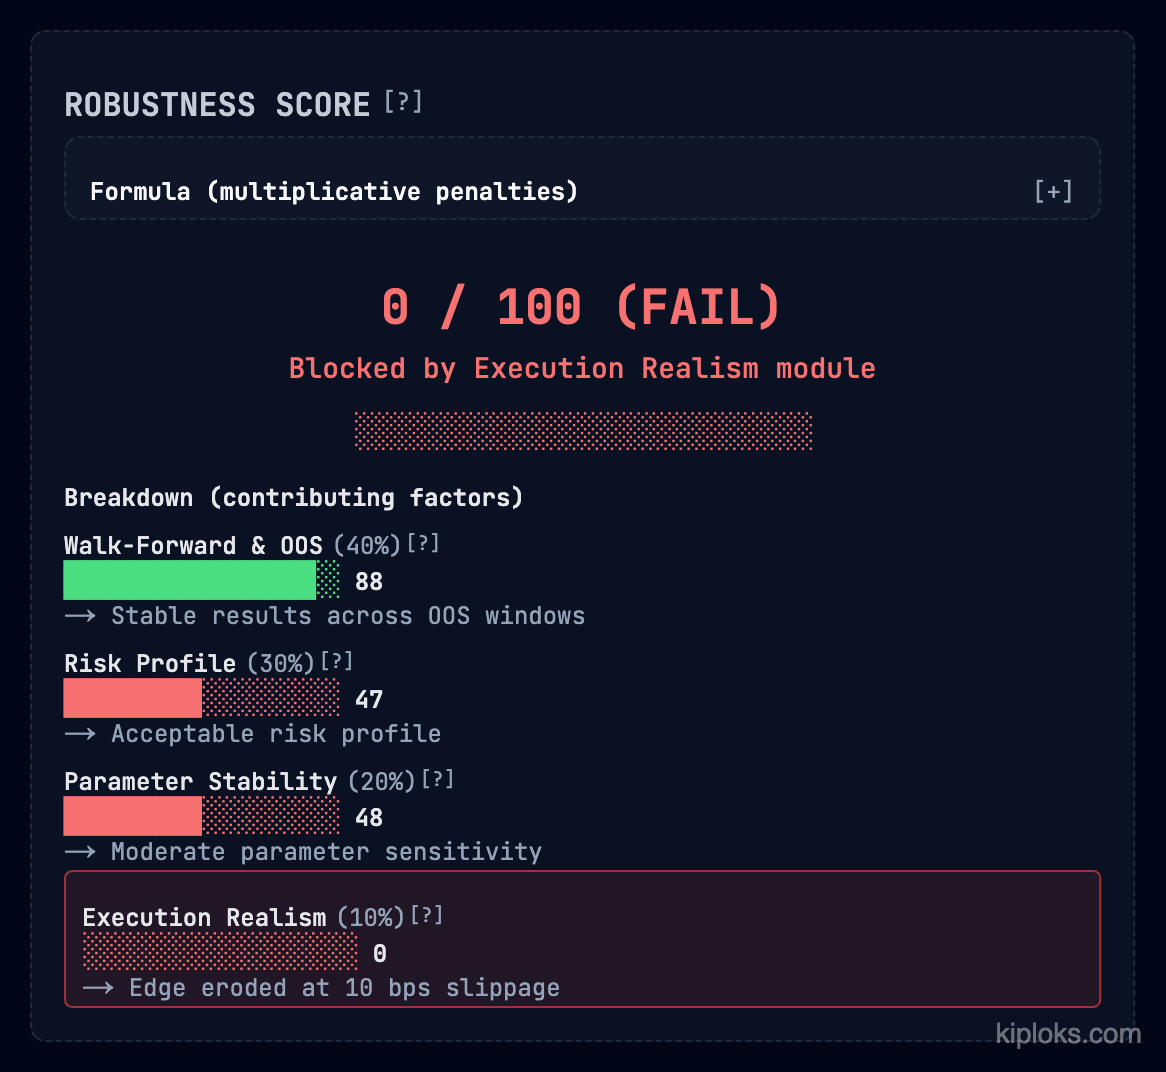
5. The Kiploks Robustness Score (0 – 100)
Framework: Multiplicative penalty logic – if any single pillar (Validation, Risk, Stability, Execution) scores a zero, the entire strategy scores a zero.
| Pillar | Weight | Score (example) |
|---|---|---|
| Walk‑Forward & OOS | 40 % | 88 (Stable) |
| Risk Profile | 30 % | 47 (Acceptable) |
| Parameter Stability | 20 % | 48 (Moderate) |
| Execution Realism | 10 % | 0 (Edge eroded) |
Final Score: 0 / 100 – because the strategy cannot survive 10 bps of slippage, it is blocked by the Execution Realism module.
 (replace with the correct image URL if needed)
Bottom line: The five‑pillar framework gives you a systematic, data‑driven way to reject weak strategies before they reach the market, saving capital and time. Use the Kiploks Robustness Score as a quick health‑check, but always dig into the individual pillars for actionable insights.
Summary: Connecting the Dots
The flow is a filter:
- Benchmark Metrics – test the edge.
- Parameter Governance – test the logic.
- Risk Metrics – test the downside.
- Verdict and Score – finalize the decision.
Together, these blocks turn a back‑test into a professional trading plan.
They force you to face the What‑If Analysis—showing you exactly what happens if frequency drops or slippage rises—before you put real capital at risk.
What You Can Do Next
- Run a Report: Put your current strategy through these five filters.
- Audit Your Parameters: Identify which of your settings are fragile and require tighter governance.
- Deep‑Dive Request: Would you like me to go deeper into the specific math behind the Robustness Score formula in Part 3? Let me know in the comments!
I am Radiks Alijevs, lead developer of Kiploks. I’m building these tools to bring institutional‑grade rigor to retail algorithmic trading. Follow me to see Part 3, where I’ll show the final robustness scoring.