From Spreadsheets to Insights The Data Mart Journey for Associations
Source: Dev.to
Introduction: Life with Spreadsheets
Most associations begin their data journey with spreadsheets.
- Membership data lives in one system.
- Events data lives in another.
- Finance numbers are maintained separately.
- Engagement data is scattered across tools.
When leadership asks questions like:
- Why are renewals going down?
- Which members are most engaged?
- Are events actually helping retention?
the answer usually involves:
- Multiple Excel files
- Manual data pulls
- Different versions of the same report
- Time spent reconciling numbers instead of analyzing them
Spreadsheets work until they don’t. As associations grow, expectations grow too. This is where many associations begin their journey toward a Data Mart.
The Data Reality in Most Associations
Associations are data‑rich, insight‑poor.
Typical systems include:
- Association Management System (AMS)
- Membership and subscription platforms
- Event and conference tools
- Learning Management Systems (LMS)
- Finance and accounting systems
- Marketing and communication tools
Each system works well on its own. The challenge starts when questions cross systems.
Examples
- Do members who attend events renew more often?
- Does learning engagement impact retention?
- Which member segments bring long‑term value?
Spreadsheets struggle to answer these consistently.
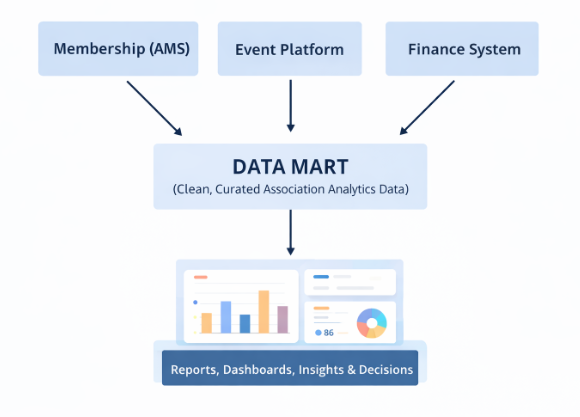
What Is a Data Mart?
A Data Mart is a curated collection of data designed for reporting and analytics.
Instead of pulling raw data every time, a Data Mart provides:
- Cleaned data
- Standardized data
- Organization around business questions
Simple analogy – Source systems are storage rooms; a Data Mart is a well‑organized store where everything is easy to find.
For associations, Data Marts are often focused on:
- Membership
- Events
- Engagement
- Finance
- Renewals
A Data Mart does not replace your systems; it helps you understand them better.
The Data Mart Journey
Core Use Case: Understanding Why Members Don’t Renew
The Question
“Why are some members not renewing?”
The Spreadsheet Reality
Data lives in different places:
- Renewal history in AMS
- Event participation elsewhere
- Engagement emails in marketing tools
- Payments in finance systems
Manually combining this data:
- Takes time
- Introduces errors
- Cannot be repeated easily
Insights remain surface‑level.
How a Data Mart Changes This
A Membership Data Mart can include:
- Member profile
- Join date and tenure
- Renewal history
- Event attendance
- Learning participation
- Communication engagement
Once curated, you can ask:
- Do first‑year members churn more?
- Do engaged members renew at higher rates?
- Does event participation affect renewal?
- Which segments are consistently at risk?
This shifts conversations from:
“Renewals are down”
to
“Members with low engagement in the first 6 months are most at risk.”
That’s actionable insight.
A Data Mart helps identify where and why members drop off.
Other Practical Association Use Cases
Event Analytics
- Who attends events repeatedly?
- Which events influence renewals?
- Revenue vs. engagement analysis
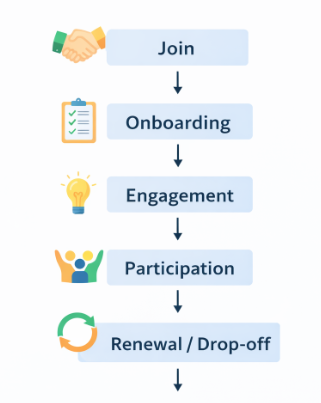
Member Lifecycle Tracking
- Engagement scoring
- Drop‑off points
- Long‑term value analysis
Leadership & Board Reporting
- Consistent KPIs
- Quarterly trends
- One trusted version of the numbers
Data Mart vs. Data Warehouse
| Aspect | Data Warehouse | Data Mart |
|---|---|---|
| Scope | Organization‑wide | Subject‑focused |
| Complexity | High | Moderate |
| Time to Value | Longer | Faster |
| Best Fit | Large enterprises | Associations |
Most associations start with a Data Mart, then evolve if needed.
A Light Technical View
Behind the scenes, Data Marts are built using ETL / ELT pipelines:
- Extract data from source systems
- Transform it into usable formats
- Load it into analytical storage
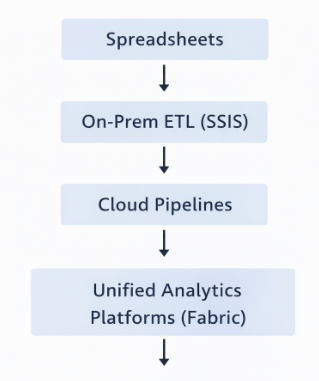
Evolution of Tools
| Era | Typical Tools |
|---|---|
| Earlier | SSIS, on‑prem databases |
| Then | Cloud pipelines (Azure Data Factory, Azure Pipelines) |
| Now | Unified platforms like Microsoft Fabric |
These tools:
- Reduce complexity
- Improve scalability
- Speed up insights
Note: Tools enable the journey; they are not the journey.
From Data to Insights: Reporting & Analytics
Once data is in the Data Mart:
- Business users should not depend on IT for every question.
- Reports should be intuitive.
- Insights should be easy to explore.
Power BI (or similar tools) helps:
- Slice data by segment
- Analyze trends
- Explore data interactively
For leadership, this means:
- Faster answers
- Better conversations
- Data‑backed decisions
Common Pitfalls to Avoid
Many Data Mart initiatives fail because of:
- Trying to do everything at once
- Poor data quality
- No business ownership
- Treating the effort as a one‑off project rather than an ongoing capability
Data Mart: More Than Just a Technical Project
Success Comes From
- Clear business questions
- Incremental delivery
- Strong collaboration
A Practical Roadmap for Associations
A simple, realistic approach:
- Identify key questions (renewals, engagement, events)
- Start with one subject area
- Clean and standardize data
- Build dashboards
- Improve incrementally
Progress matters more than perfection.
The Bigger Shift: From Reports to Conversations
The real value of a Data Mart isn’t the data itself—it’s what the data enables:
- Better questions
- Confident decisions
- Meaningful conversations
Associations that move from spreadsheets to insights don’t just improve reporting; they change how decisions are made.
Conclusion
A Data Mart is not about technology hype. It’s about:
- Understanding members better
- Acting on insights
- Supporting the association’s mission
The journey may start with spreadsheets, but it should not end there.