Data modelling in Power BI: Joins, Relationships, and Schemas Explained.
Source: Dev.to
Data modelling
Data modelling is the process of analyzing and defining different data types and the relationships between them.
SQL joins
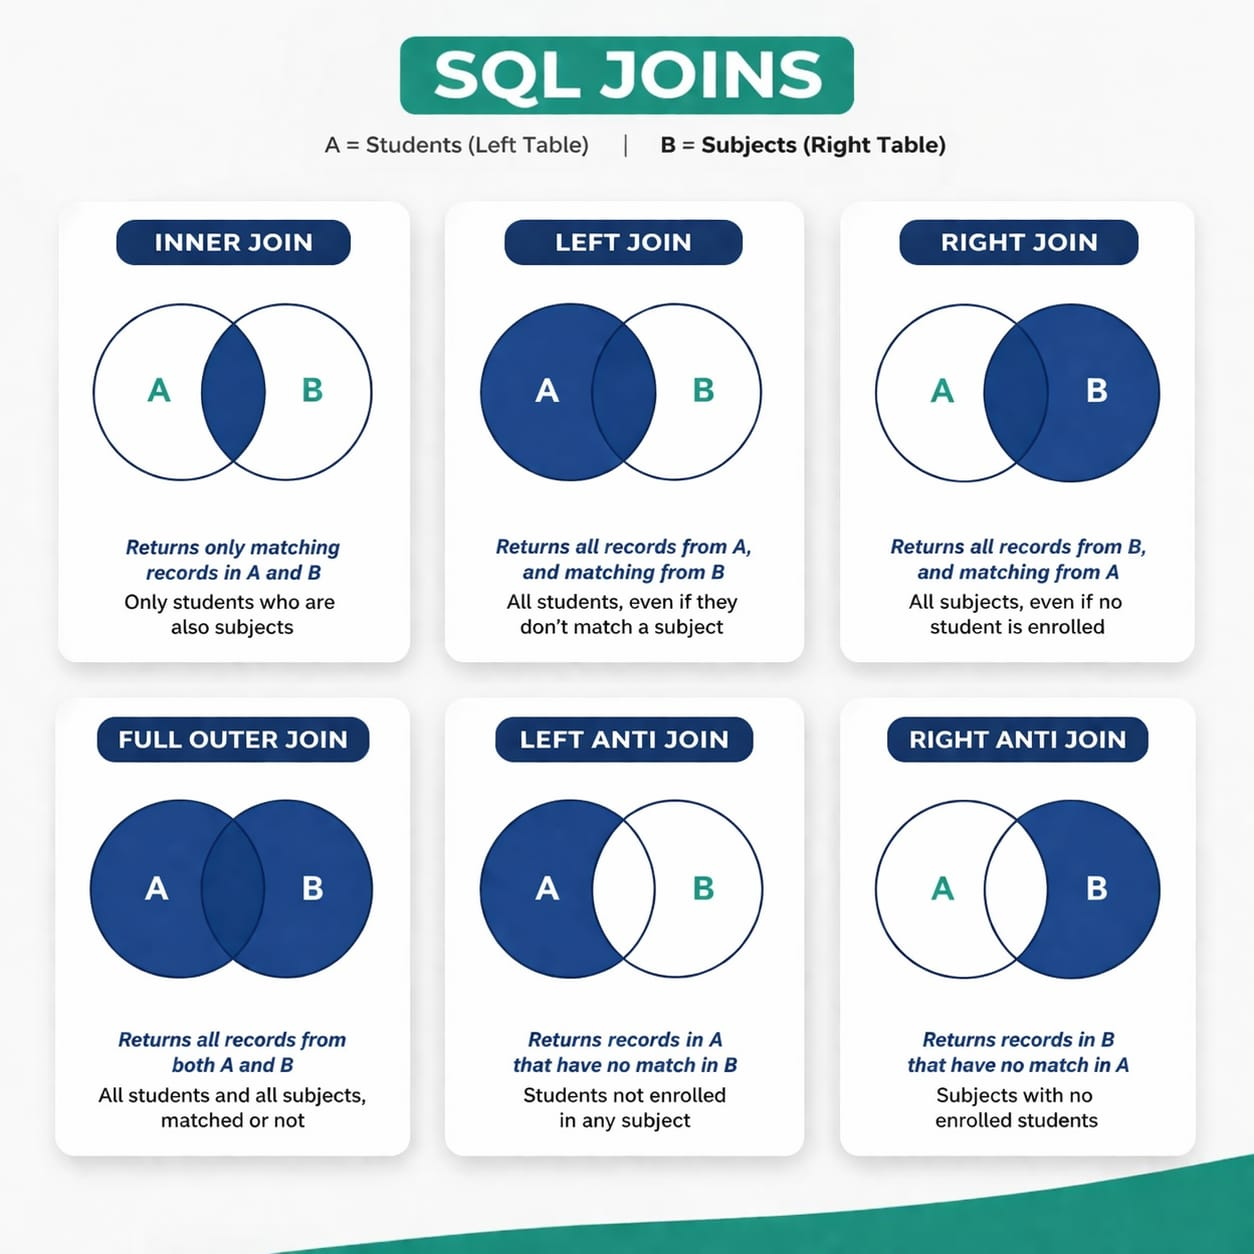
Assume Table A (left) and Table B (right) as the data sets.
Inner Join
Returns only rows with matches from both Table A and Table B.
Left Join
Returns all rows from the left table (A) and matching rows from the right table (B). Rows from Table B that have no match appear as NULL.
Right Join
Returns all rows from the right table (B) and matching rows from the left table (A). Rows from Table A that have no match appear as NULL.
Full Outer Join
Returns all rows from both tables, with NULL in places where there is no match.
Left Anti Join
Returns rows from the left table (A) that have no match in the right table (B).
Right Anti Join
Returns rows from the right table (B) that have no match in the left table (A).
Illustrations of Joins
Power BI relationships
Relationships connect tables using keys.
One‑to‑Many (1:M)
The most common relationship; one record in the primary table relates to many records in the related table.
Example: One patient has many visits.
Many‑to‑Many (M:M)
Both tables contain duplicate values, allowing many records on each side to relate to many on the other.
Example: Patients and diseases—one patient can have many diseases, and one disease can affect many patients.
One‑to‑One (1:1)
Each record in one table matches exactly one record in the other table.
Example: Patients and their National Identification Number (NIN).
Cardinality defines the relationship type between two tables (e.g., 1:M, 1:1, M:M).
Fact vs. Dimension tables
- Fact tables contain measurable, quantitative data such as visits, sales, or cases.
- Dimension tables contain descriptive attributes such as patient details, location, or time.
Schemas
How tables are organized in a data model:
- Star Schema – A central fact table surrounded by dimension tables.
- Snowflake Schema – Dimension tables are normalized into smaller related tables (e.g., location → country → region → district).
- Flat table (DLAT) – All data is stored in a single denormalized table.
Role‑playing dimensions
A single dimension table is used multiple times in different roles within the model (e.g., a Date table used for Order Date, Ship Date, and Invoice Date).