🌦 Building an Advanced Weather Dashboard with Dark Mode, Map & Forecast
Source: Dev.to
🚀 Introduction
Most weather app tutorials only show temperature and a weather icon.
Real‑world applications need structure, scalability, and user experience.
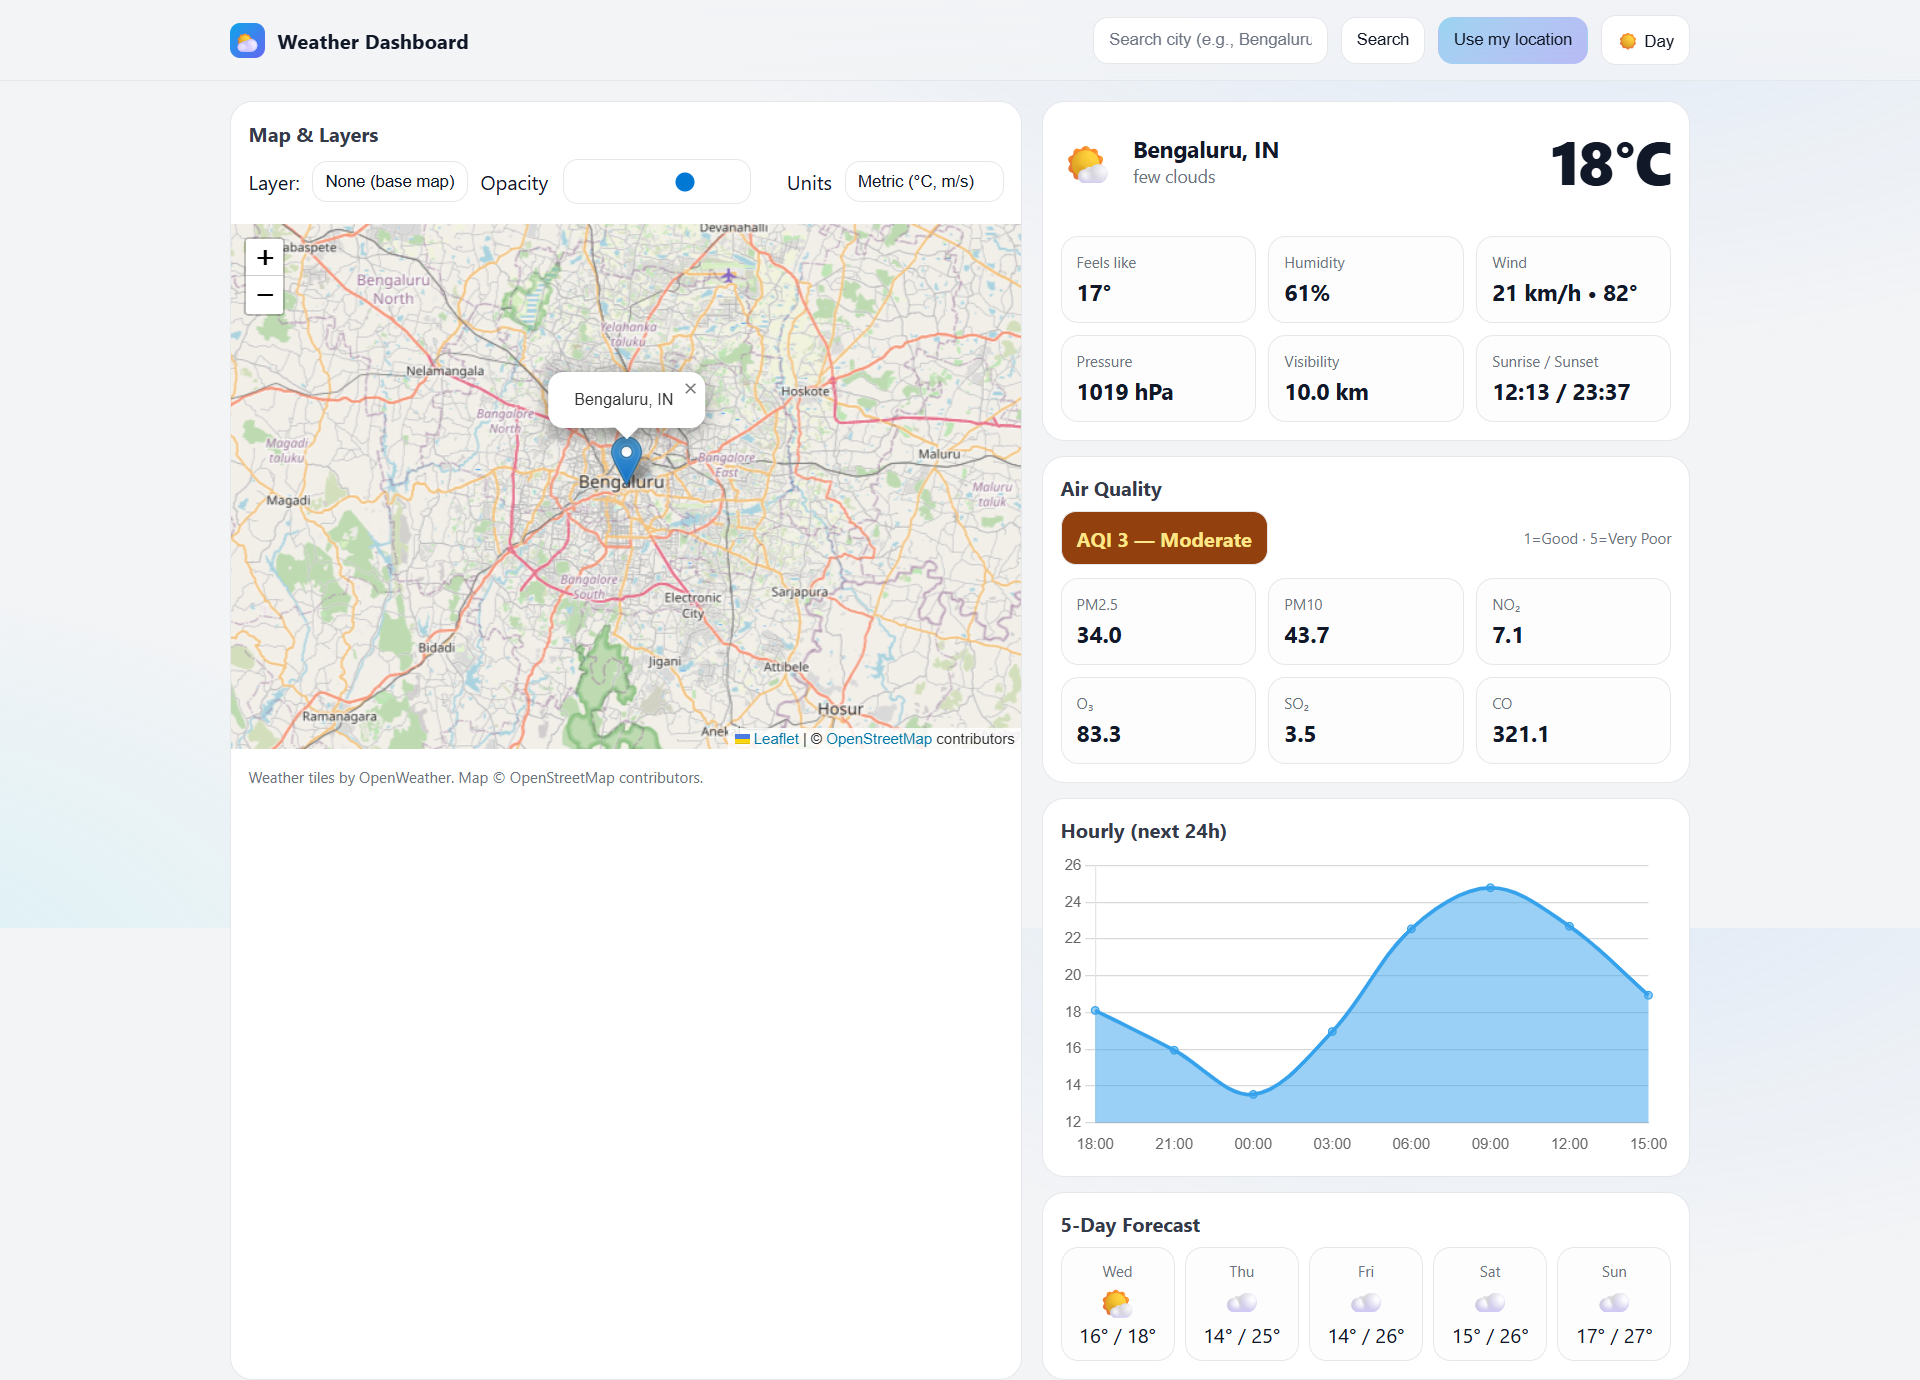
In this project we build a professional Weather Dashboard using HTML, CSS, and JavaScript, integrated with the OpenWeather API and Leaflet Map, including a fully functional Dark Mode.
It’s portfolio‑ready and demonstrates real frontend skills.
🎯 What You’ll Build
By the end of this project you’ll have:
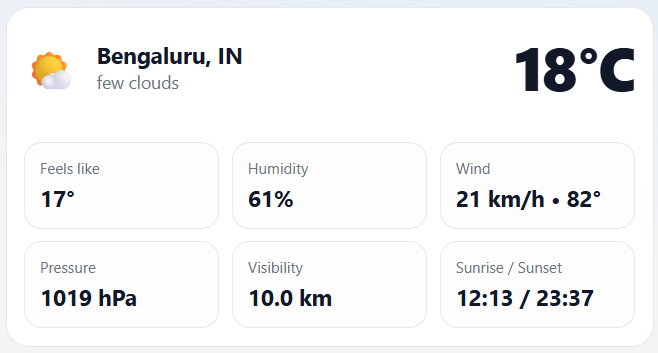
- 🌦 Real‑time weather data
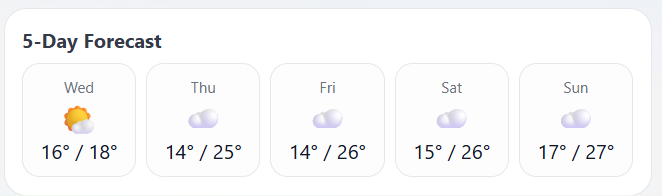
- 📅 5‑day weather forecast
- 🌙 Dark / Light mode toggle
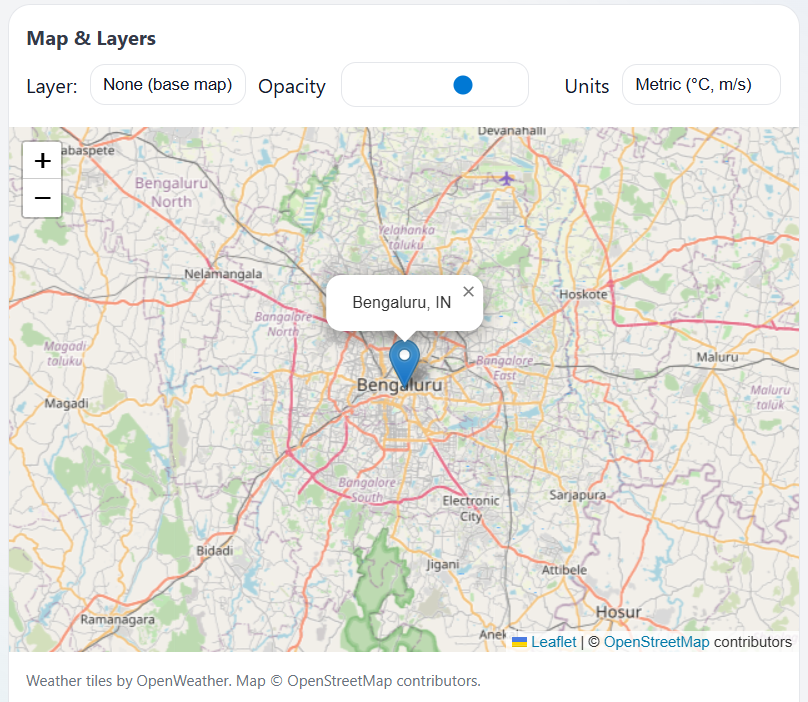
- 🗺 Interactive map using Leaflet
- 🔌 API integration with
async/await - 🧠 Clean JavaScript architecture
- 🧪 Manual testing & error handling
👉 Watch the full video tutorial:
🧱 Project Structure
A clean and simple project structure keeps the app maintainable:
weather-dashboard/
├── index.html
├── style.css
└── script.js
🎨 UI Design with HTML & CSS
The UI uses a dashboard‑style layout with:
- Responsive cards
- Clean typography
- Flexible layout
Dark mode friendly colors improve accessibility and user experience.
🌙 Dark Mode (Day / Night Theme)
The theme toggle is handled with:
- CSS variables
- JavaScript theme‑switch logic
The UI state persists across sessions, allowing easy expansion to more themes in the future.
🌐 OpenWeather API Integration
The app fetches data from the OpenWeather API:
Current weather data
5‑day forecast data
Key JavaScript concepts
fetch()withasync/await- Error handling with
try/catch - API response validation to keep the app stable during failures
📅 Forecast Logic Explained
Instead of displaying every forecast entry, the app:
- Filters data by day
- Extracts relevant timestamps
Only meaningful daily forecasts are shown, keeping the UI clean and user‑friendly.
🗺 Leaflet Map Integration
An interactive map enhances the experience.
Features
- Latitude & longitude from the weather API
- Live location markers
- Dynamic map updates on city search
Leaflet is lightweight, fast, and perfect for frontend dashboards.
🧠 JavaScript Architecture
The codebase is organized with:
- Helper functions for API calls
- Separate UI rendering logic
- Reusable utility functions
This structure makes the project scalable and interview‑friendly.
🧪 Manual Testing & Debugging
Before completion the app is tested for:
- Invalid city names
- Empty input fields
- Network failures
Proper error handling ensures the project behaves like a real application.
🚀 How to Improve This Project
Ideas for extending the dashboard:
- ⭐ Save favorite cities
- 📍 Auto‑detect user location
- ⚡ Convert to a PWA
- ⚛️ Rebuild using React
- 🔐 Add backend support
Comment “IMPROVE” on the video to suggest the next upgrade.
📺 Full Video Tutorial
Build an Advanced Weather Dashboard with Dark Mode & Map
🏁 Final Thoughts
This project is ideal for developers who want to:
- Improve API handling skills
- Build real‑world dashboards
- Create strong portfolio projects
Projects build confidence. Confidence builds careers.
Happy coding! 💻🔥