Building a 3D Map Application Using Mapterhorn Terrain Data
Source: Dev.to
About Mapterhorn

Mapterhorn is an open‑data project that publishes terrain data as PMTiles.
It creates terrain tiles from a variety of public sources (e.g., ESA’s Copernicus DEM, Switzerland’s swissALTI3D) and makes them freely available.
The project is led by Oliver Wipfli, formerly of MapLibre.
I highlighted Mapterhorn as a “project to watch” in my talks at FOSS4G Hokkaido 2025 and FOSS4G Japan 2025.
Presentation Slides
Geospatialの世界最前線を探る [2025年版] – Speaker Deck

View the full deck on Speaker Deck
FOSS4G 2025 Japan – Presentation Material

Access the slides on Speaker Deck
Dataset Overview
Mapterhorn creates terrain tiles by combining multiple open‑data sources.
Global Data
| Data Source | Resolution | Zoom Levels | Notes |
|---|---|---|---|
| Copernicus GLO‑30 | 30 m | z0 – z12 | ESA Global DEM |
The global dataset is based on ESA’s Copernicus GLO‑30 model and covers the entire world up to z12.
High‑Resolution Data
 {width=800}
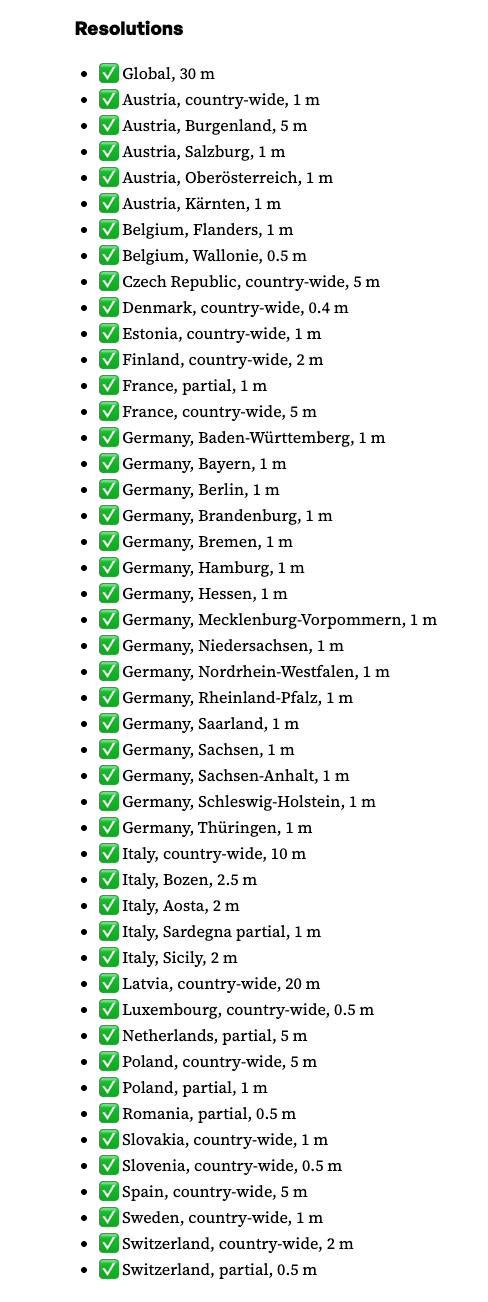
In addition to the global dataset, Mapterhorn provides high‑resolution data from open DEM/LiDAR sources in several European countries.
- Switzerland – swisstopo’s swissALTI3D (0.5 m resolution)
Japan Data
Update (Dec 2025): High‑resolution data for Japan has been added.
- ✅ Japan (country‑wide) – 1 m, 5 m, 10 m
LinkedIn announcement:
Pull request adding the sources (replace with actual URL)
Advance Preparation
Execution Environment
- Node v24.4.1
- npm v11.4.2
MapLibre GL JS Starter
Fork or download the starter repository and run it locally.
Repository Structure
maplibregljs-starter
├── dist
│   └── index.html
├── img
├── src
│   ├── main.ts
│   ├── style.css
│   └── vite-env.d.ts
├── README.md
├── LICENSE
├── index.html
├── package-lock.json
├── package.json
├── tsconfig.json
└── vite.config.ts
Install Dependencies
npm install          # install project dependencies
npm install pmtiles  # add the PMTiles library
package.json
{
  "name": "maplibregljs-starter",
  "version": "4.5.0",
  "description": "",
  "scripts": {
    "dev": "vite",
    "build": "tsc && vite build",
    "preview": "vite preview"
  },
  "keywords": [],
  "author": "MapLibre User Group Japan",
  "license": "ISC",
  "devDependencies": {
    "typescript": "^5.5.2",
    "vite": "^5.3.2"
  },
  "dependencies": {
    "maplibre-gl": "^4.5.0",
    "pmtiles": "^4.3.0"
  }
}
Creating the Map Application
The code below shows how to display Mapterhorn terrain data with MapLibre GL and the PMTiles protocol.
- Replace the contents of
src/main.tswith the following. - Run the development server with
npm run dev. - Open the URL printed in the terminal (usually
http://localhost:5173) to see the terrain rendered with hill‑shade shading.
// src/main.ts
import './style.css';
import 'maplibre-gl/dist/maplibre-gl.css';
import maplibregl from 'maplibre-gl';
import { Protocol } from 'pmtiles';

// Enable the PMTiles protocol (metadata support is optional but useful)
const protocol = new Protocol({ metadata: true });

/**
 * Register a custom protocol (`mapterhorn://`) that resolves to PMTiles tiles.
 * The protocol extracts the z/x/y values from the URL, builds the PMTiles URL,
 * and asks the PMTiles library to fetch the tile.
 */
maplibregl.addProtocol('mapterhorn', async (params, abortController) => {
  const [z, x, y] = params.url
    .replace('mapterhorn://', '')
    .split('/')
    .map(Number);

  // Simple naming scheme – adjust if your PMTiles files follow a different convention.
  const name = `${z}-${x}-${y}`;

  // Build the PMTiles URL. The tile is stored as a WebP image inside the PMTiles file.
  const url = `pmtiles://download.mapterhorn.com/${name}.pmtiles/${z}/${x}/${y}.webp`;

  const response = await protocol.tile({ ...params, url }, abortController);

  if (response.data === null) {
    throw new Error(`Tile z=${z} x=${x} y=${y} not found.`);
  }

  return response;
});

// Initialise the MapLibre map
const map = new maplibregl.Map({
  container: 'map',
  hash: true,
  style: {
    version: 8,
    sources: {
      hillshadeSource: {
        type: 'raster-dem',
        tiles: ['mapterhorn://{z}/{x}/{y}'],
        encoding: 'terrarium',
        tileSize: 512,
        attribution: '[© Mapterhorn](https://mapterhorn.com/attribution)'
      }
    },
    layers: [
      {
        id: 'hillshade',
        type: 'hillshade',
        source: 'hillshadeSource'
      }
    ]
  },
  center: [138.7782, 35.3019], // Approx. Osaka, Japan
  zoom: 10
});

map.addControl(new maplibregl.NavigationControl());
Running the Application
npm run devAfter the dev server starts, open the URL shown in the terminal (typically http://localhost:5173). You should see the Mapterhorn terrain visualised with hill‑shade rendering.
Tip: If your PMTiles naming scheme differs from the simple
${z}-${x}-${y}pattern used above, replace thenameconstruction logic insideaddProtocolwith the appropriate calculation.
Add Navigation Control
map.addControl(
  new maplibregl.NavigationControl({
    visualizePitch: true
  })
);
3‑D Terrain Rendering
MapLibre GL JS’s terrain feature makes it easy to visualise 3‑D terrain. The example below shows how to:
- add a custom
pmtilesprotocol for raster‑DEM tiles, - load a raster basemap,
- display hill‑shade and a 3‑D terrain surface,
- add a navigation control with pitch visualisation.
Example Code
// style.css is imported only for the page layout – it is not required for the map itself.
import './style.css';
import 'maplibre-gl/dist/maplibre-gl.css';
import maplibregl from 'maplibre-gl';
import { Protocol } from 'pmtiles';

// Initialise the PMTiles protocol (metadata is required for DEM tiles)
const protocol = new Protocol({ metadata: true });

/**
 * Custom protocol “mapterhorn” that resolves DEM tiles stored as PMTiles.
 * The tile URL format used by Mapterhorn is:
 *   pmtiles://https://download.mapterhorn.com/<name>.pmtiles/<z>/<x>/<y>.webp
 *
 * The <name> part is derived from the zoom level and the y‑coordinate.
 */
maplibregl.addProtocol('mapterhorn', async (params, abortController) => {
  const [z, x, y] = params.url
    .replace('mapterhorn://', '')
    .split('/')
    .map(Number);

  // Example naming scheme – adjust if your tile set uses a different pattern
  const name = `${z}-${y >> (z - 6)}`; // “z‑shifted‑y” pattern used by Mapterhorn

  const url = `pmtiles://https://download.mapterhorn.com/${name}.pmtiles/${z}/${x}/${y}.webp`;

  const response = await protocol.tile({ ...params, url }, abortController);
  if (response.data === null) {
    throw new Error(`Tile z=${z} x=${x} y=${y} not found.`);
  }
  return response;
});

// Create the map
const map = new maplibregl.Map({
  container: 'map',
  hash: 'map',
  style: {
    version: 8,
    sources: {
      // Basemap
      MIERUNEMAP: {
        type: 'raster',
        tiles: ['https://tile.mierune.co.jp/mierune/{z}/{x}/{y}.png'],
        tileSize: 256,
        attribution:
          'Maptiles by MIERUNE, under CC BY. Data by OpenStreetMap contributors, under ODbL.'
      },

      // DEM source (raster‑DEM)
      terrainSource: {
        type: 'raster-dem',
        tiles: ['mapterhorn://{z}/{x}/{y}'],
        encoding: 'terrarium',
        tileSize: 512,
        attribution: '[© Mapterhorn](https://mapterhorn.com/attribution)'
      }
    },

    layers: [
      { id: 'MIERUNEMAP', type: 'raster', source: 'MIERUNEMAP' },
      { id: 'hillshade', type: 'hillshade', source: 'terrainSource' }
    ],

    terrain: {
      source: 'terrainSource',
      exaggeration: 1.5
    }
  },

  center: [138.8016, 35.2395],
  zoom: 11,
  pitch: 60,
  bearing: -20
});

map.addControl(
  new maplibregl.NavigationControl({
    visualizePitch: true
  })
);
Screenshots
| Description | Image |
|---|---|
| Map with navigation control |  |
| Map with 3‑D terrain |  |
Tip: Adjust the exaggeration value in the terrain object to suit your visual style. A higher value makes mountains appear steeper; a value near 1 renders terrain at true scale.