Alibaba Cloud Observability and Datadog Release OpenTelemetry Go Automatic Instrumentation Tool
Source: Dev.to
How It Works
The automatic instrumentation tool leverages the -toolexec parameter of the Go compiler. -toolexec intercepts the go command and replaces it with our instrumentation tool, giving us a chance to analyze and modify the source before compilation. The process consists of two phases:
1. Dependency Analysis
- Before compilation starts, the tool runs
go build -nto analyze the build flow and detect third‑party libraries used in the project (e.g.,net/http,grpc,redis). - It then automatically generates a file named
otel.runtime.goand imports the corresponding Hook code (the monitoring logic) into the build dependencies.
2. Code Injection
- When the compiler processes a target function, the tool again uses
-toolexecto intercept compilation and modifies the function’s code. - A Trampoline snippet is inserted at the function entry point, which jumps to a pre‑written Hook function.
The Hook performs three actions:
| Phase | What the Hook Does |
|---|---|
| Before (function entry) | Records the start time, extracts context information (e.g., HTTP headers), and starts a span. |
| During (original business logic) | Executes the original function body unchanged. |
| After (function exit) | Captures the return value or panic, ends the span, and records the duration. |
Because the instrumentation is compiled directly into the binary, it incurs zero runtime overhead (apart from the inevitable execution time of the monitoring logic). Unlike eBPF, it does not require kernel‑space ↔ user‑space transitions, and unlike Java agents, it does not need a runtime loading step.
HTTP Instrumentation Example
Simple HTTP Server (no instrumentation)
package main

import (
	"log"
	"net/http"
)

func main() {
	http.HandleFunc("/greet", func(w http.ResponseWriter, r *http.Request) {
		_, _ = w.Write([]byte("Hello, OpenTelemetry!"))
	})
	log.Fatal(http.ListenAndServe(":8080", nil))
}
Manual Instrumentation
package main

import (
	"context"
	"log"
	"net/http"

	"go.opentelemetry.io/otel"
	"go.opentelemetry.io/otel/attribute"
	"go.opentelemetry.io/otel/sdk/trace"
)

func initTracer() func(context.Context) error {
	// ... dozens of lines of initialization code ...
	return func(ctx context.Context) error { return nil }
}

func main() {
	// 1️⃣ Initialize the tracer.
	shutdown := initTracer()
	defer shutdown(context.Background())

	// 2️⃣ Wrap the handler.
	handler := http.HandlerFunc(func(w http.ResponseWriter, r *http.Request) {
		// 3️⃣ Manually extract the context and start the span.
		tracer := otel.Tracer("demo-server")
		ctx, span := tracer.Start(r.Context(), "GET /greet")
		defer span.End()

		// 4️⃣ Record attributes if needed.
		span.SetAttributes(attribute.String("http.method", "GET"))

		// 5️⃣ Business logic.
		_, _ = w.Write([]byte("Hello, OpenTelemetry!"))

		// 6️⃣ (Optional) Use the derived context for downstream calls.
		_ = ctx
	})

	// 7️⃣ Start the server.
	log.Fatal(http.ListenAndServe(":8080", handler))
}
For microservices with hundreds or thousands of APIs, manually adding such code becomes catastrophic in terms of effort and maintenance.
Automatic Instrumentation
Download the tool – Grab the binary from the Release Page1.
Compile the application
./otel-linux-amd64 go build -o myappConfigure and run
export OTEL_EXPORTER_OTLP_ENDPOINT="http://localhost:4317"
export OTEL_SERVICE_NAME="my-app"
./myapp
The compiler silently “weaves” HTTP‑request monitoring logic into the binary. After configuring an OpenTelemetry exporter (e.g., Jaeger, console), running the server will automatically generate and report tracing data for the /greet endpoint, including URI, duration, and status code—without any code changes.
From Commercial to Open‑Source
During extensive eBPF practice, we recognized its power but also its difficulty in perfectly handling application‑layer context. More importantly, user feedback repeatedly highlighted the pain of tedious manual tracking and high maintenance costs.
To solve this problem, we explored a Go compile‑time automatic instrumentation solution, initially publishing it to Alibaba Cloud Observability’s Application Real‑Time Monitoring Service (ARMS)2. Continuous iteration in this rigorous “experimental field” matured the approach into a robust, open‑source solution that delivers zero‑code tracing for Go applications.
References
Enhanced Observability Features
The solution also extends support for rich, advanced capabilities such as:
- Metric statistics
- Runtime monitoring
- Continuous profiling
It can even complete the event‑tracking of an enterprise’s internal SDK via custom extension features [4].
Tracing Analysis
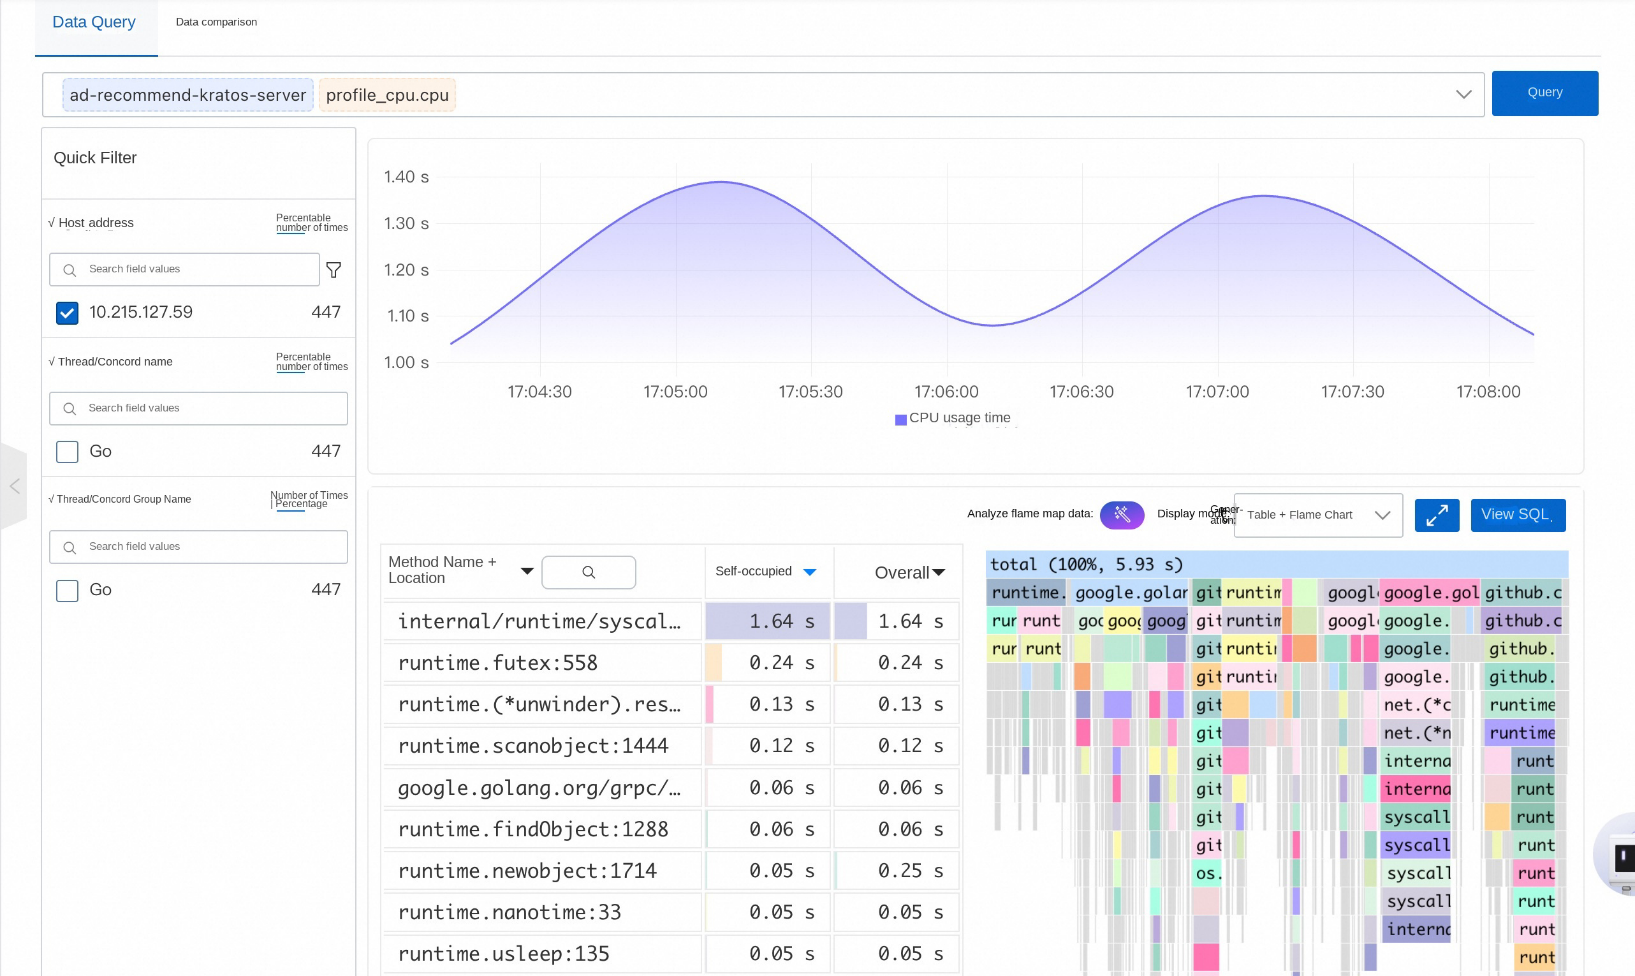
Continuous Profiling
This solution has been successfully verified by customers in many realms, including e‑commerce, short‑form video, AI video, and automotive. After seeing the immense value it brings to users and confirming its stability and feasibility, we decided to contribute its core capabilities to the OpenTelemetry community, hoping it will become an inclusive technology.
We also collaborated with Datadog, a leading vendor in the observability space, to jointly promote and ultimately facilitate the birth of this official project [1].
The project is currently in active development. We welcome everyone to try it out, provide feedback, and contribute to building a better cloud‑native observability ecosystem.
References
- OpenTelemetry Go compile‑instrumentation project –
- Release link –
- Alibaba Cloud ARMS Go Agent (Commercial Edition) –
- Custom extension –
Footnotes
Release page – https://github.com/open-telemetry/opentelemetry-go-compile-instrumentation/releases ↩
Alibaba Cloud Observability – ARMS documentation (internal link) ↩